Welcome to the Canvas App
The Canvas App is the in-house charting system of Superalgos. It is the software capable of running the Plotters that can represent datasets graphically.
Installation
To install the Canvas App, you need to install AAWeb. Please follow this guide:
https://github.com/Superalgos/AAWeb/blob/develop/README.md
Usage
First time you enter you will see this screen, with no chart displayed, since the app exects you to select one of the available layers at the left panel:
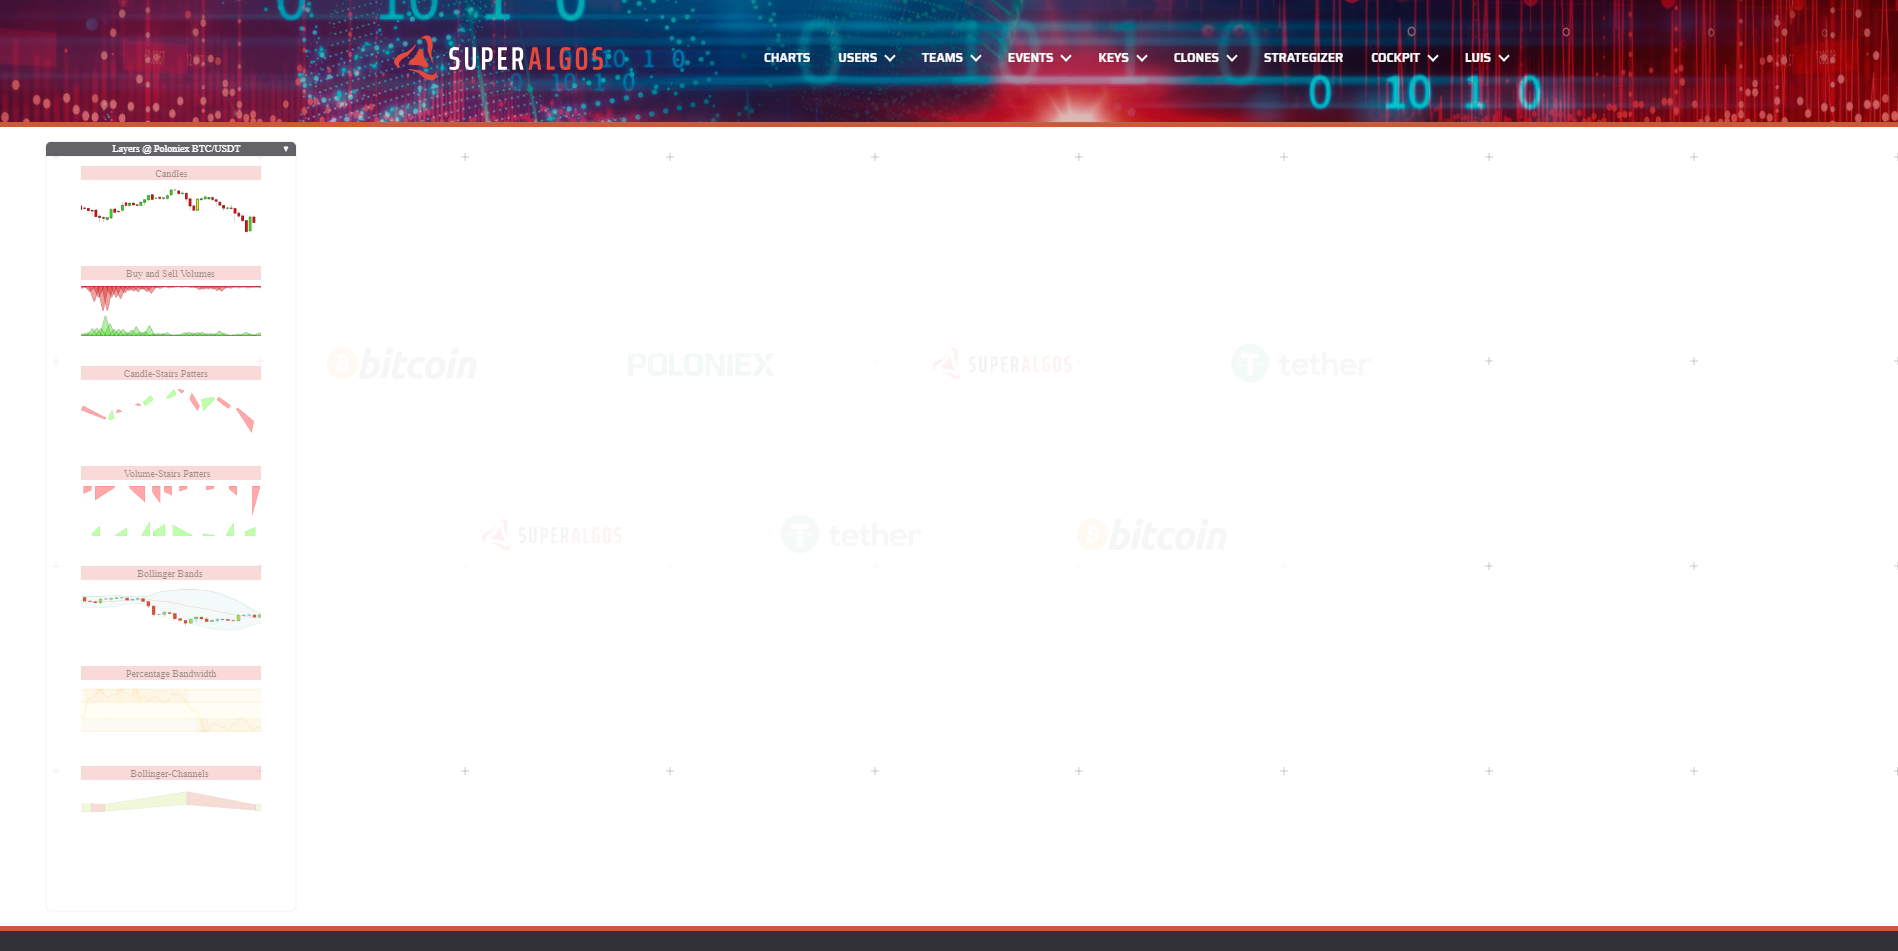
Layers Panel
This panel includes different layers you can visualize just by turning them on with a mounse click. A second click would turn them off. The layer title bar can have 3 possibles colors:
- Red: layer is off.
- Green: layer is on.
- Yellow: layer is loading or can not completelly load if it stay in this color/state.
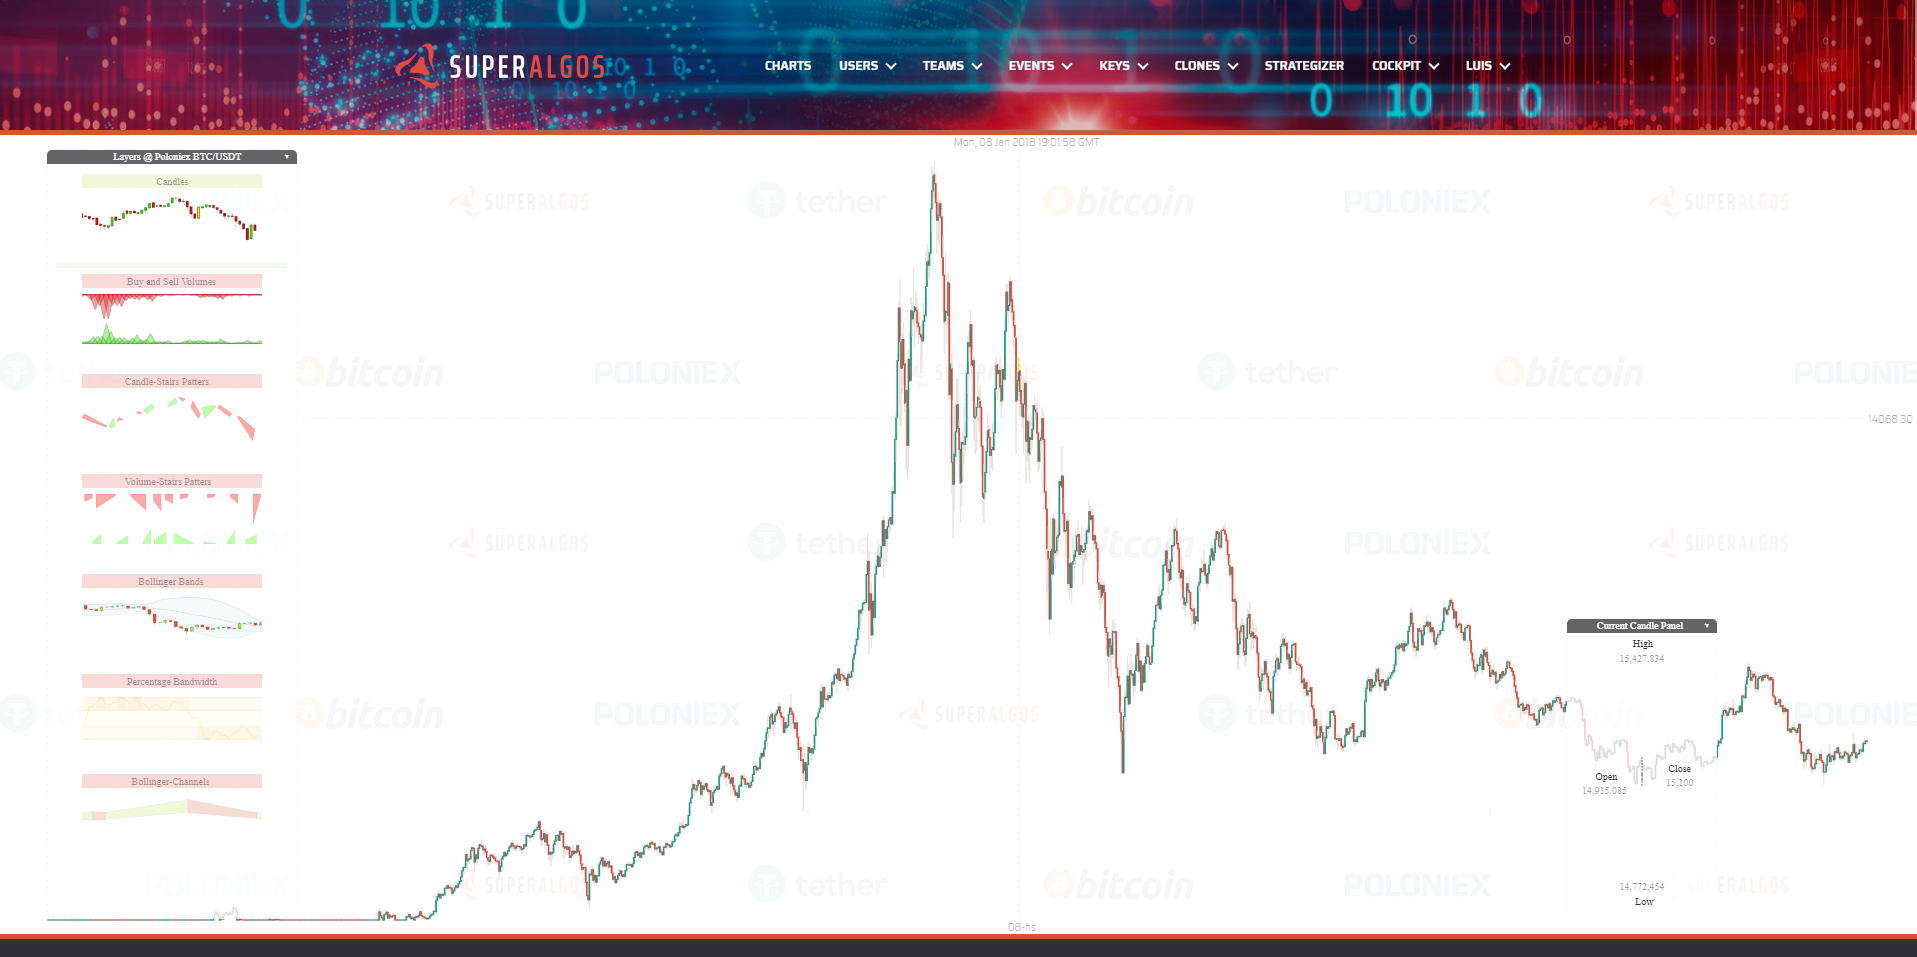
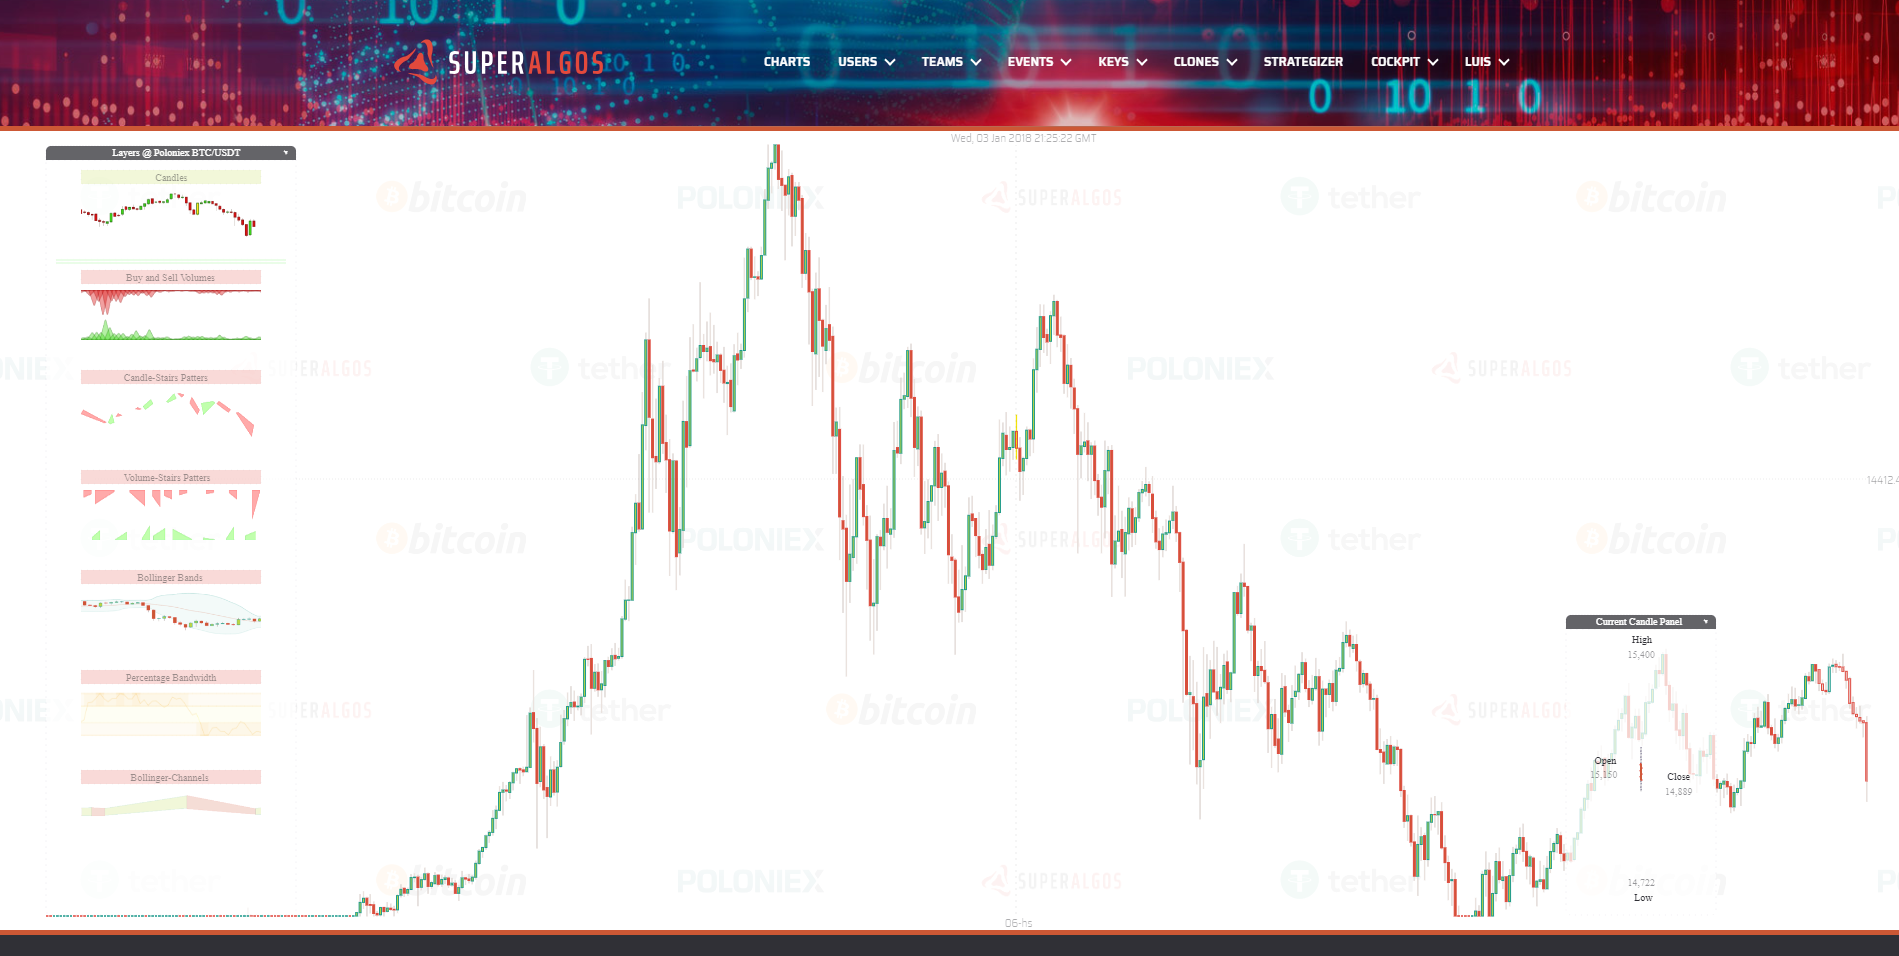
Click on the first layer "Candles" and wait a few second to load the data and plot the candles chart. At that point you should see something like this:
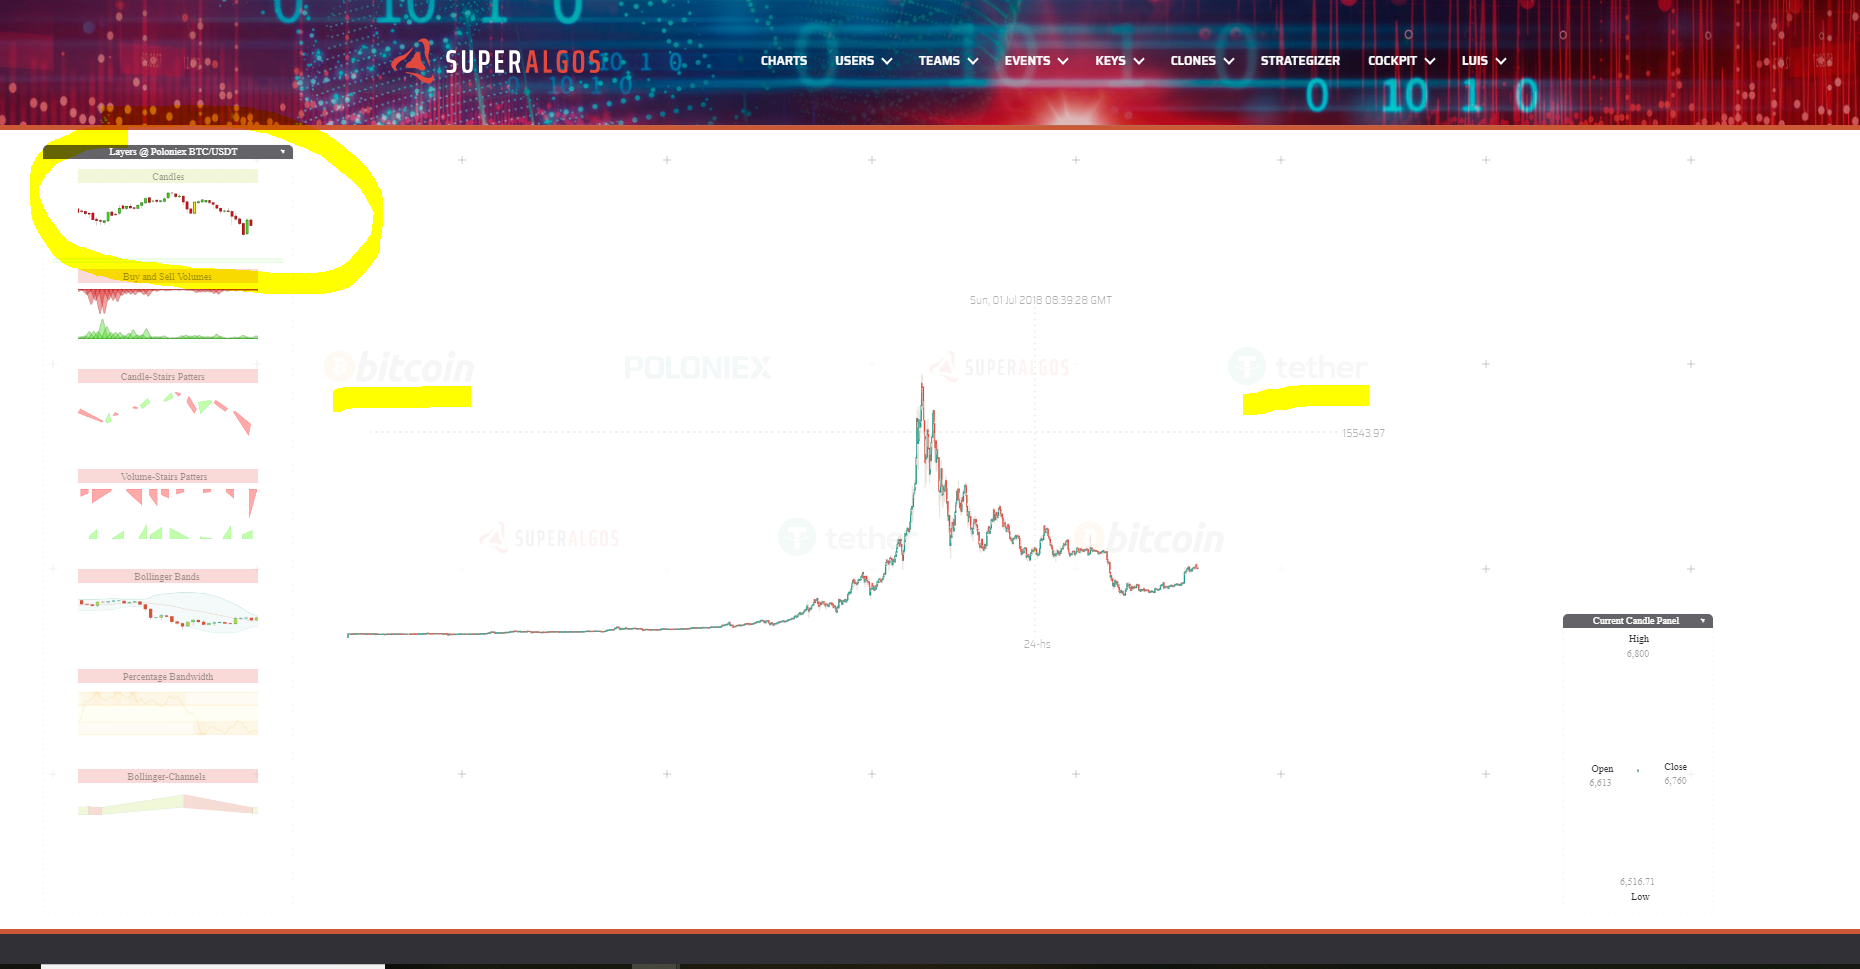
As you can see, the candles belong to the market BTC/USDT @ Poloniex. Even though the app already support other markets and other exchanges, for us is better to have only this one active while the codebase matures.
You need to notice these 3 things on your screen:
Main Elements
- The current datetime at the top. This is the date and time at the mouse pointer position.
- The current rate at the right. This is the current rate (in this case USDT per BTC) at the mouse pointer position.
- The current time period (or candle size if you wish) at the bottom. This is the currently diplayed time period, not only for candles but for any other object plotted across any of the available layers.
Mouse Wheel Operations
There are many things you can do with your mouse wheel.
- Use your mouse wheel next to the datetime to produce an horizontal scaling.
- Use your mouse wheel at the displayed rate to produce a vertical scaling.
- Use your mouse wheel next to the time period to change it amoung all the possible available time periods.
- User you mouse wheel over the Layers panel to scroll up or down the layers (in case they are not all already displayed).
- User your mouse wheel overt the chart, and not close to the previous elements to zoom in and out the chart. The App will not only zoom in and out but also automatically adjust the time period to the most convinient for the zoom level you are in.
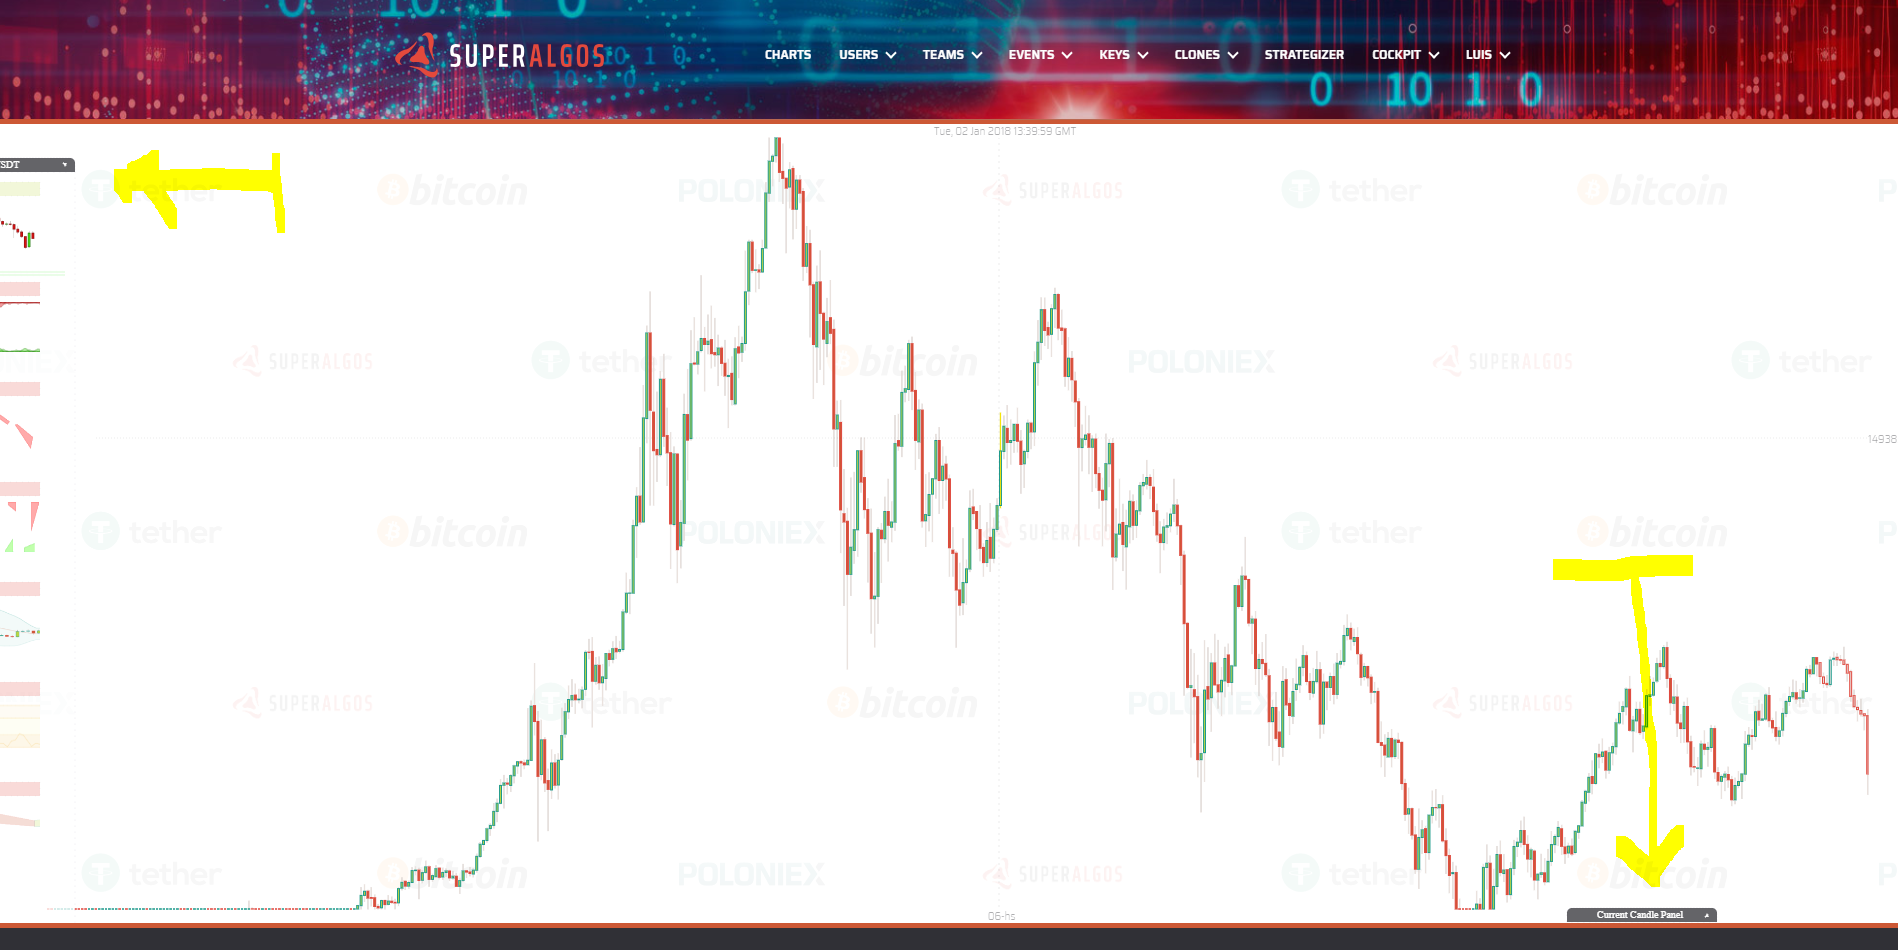
After zooming in the main elements stay at the top, left and bottom of the viewport as you can see in the next screenshot:
Hiding Panels
There are two ways to hide the panels on the screen:
- Drag them from their title bar with the right mouse button.
- Click over the small triangle at the left of their title bar. This will automatically position them at the bottom of the screen. Clicking again restores its previous position.
Here I gragged the Layers panel to the left, and I clicked at the Current Candle Panel:
Available Layers
Superalgos is an open system, that means anyone can build more layers for this chart app. So far with our current limited manpower we managed to create these ones:
- Candles: tipical candlesticks.
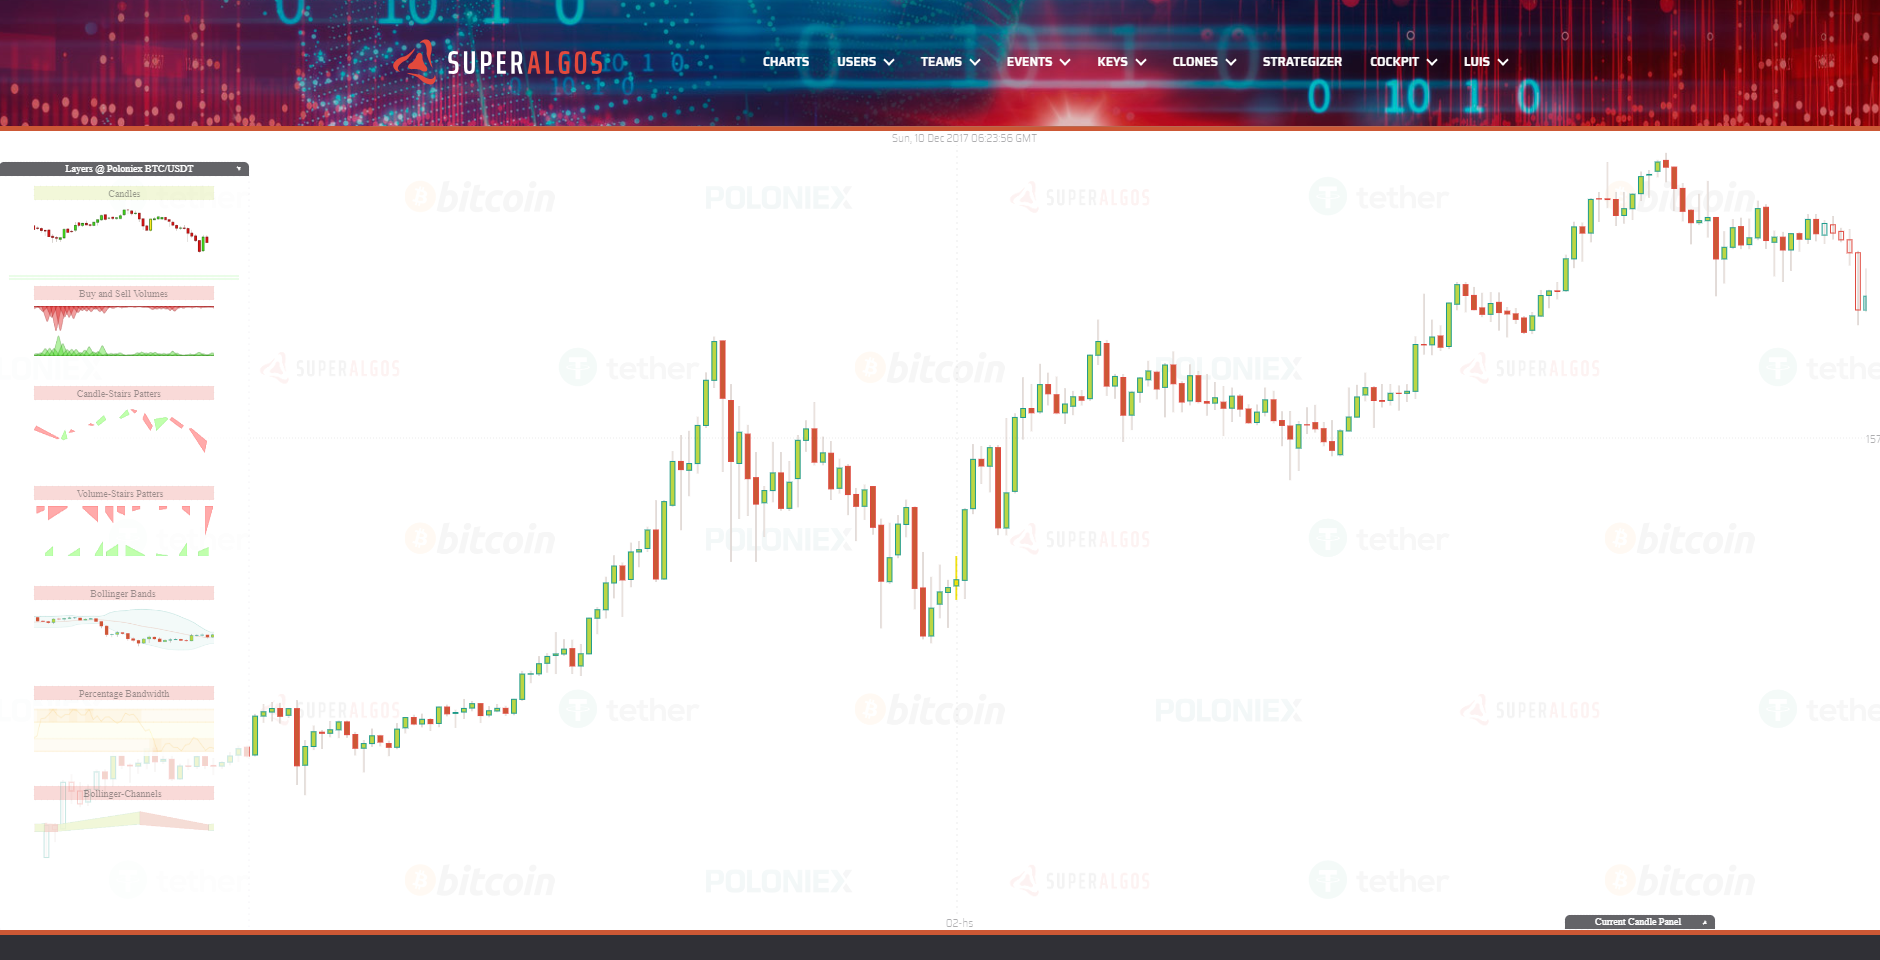
- Volumes: here I innovated a little bit, putting the buy volume down and in green, and the sell volume up and red.
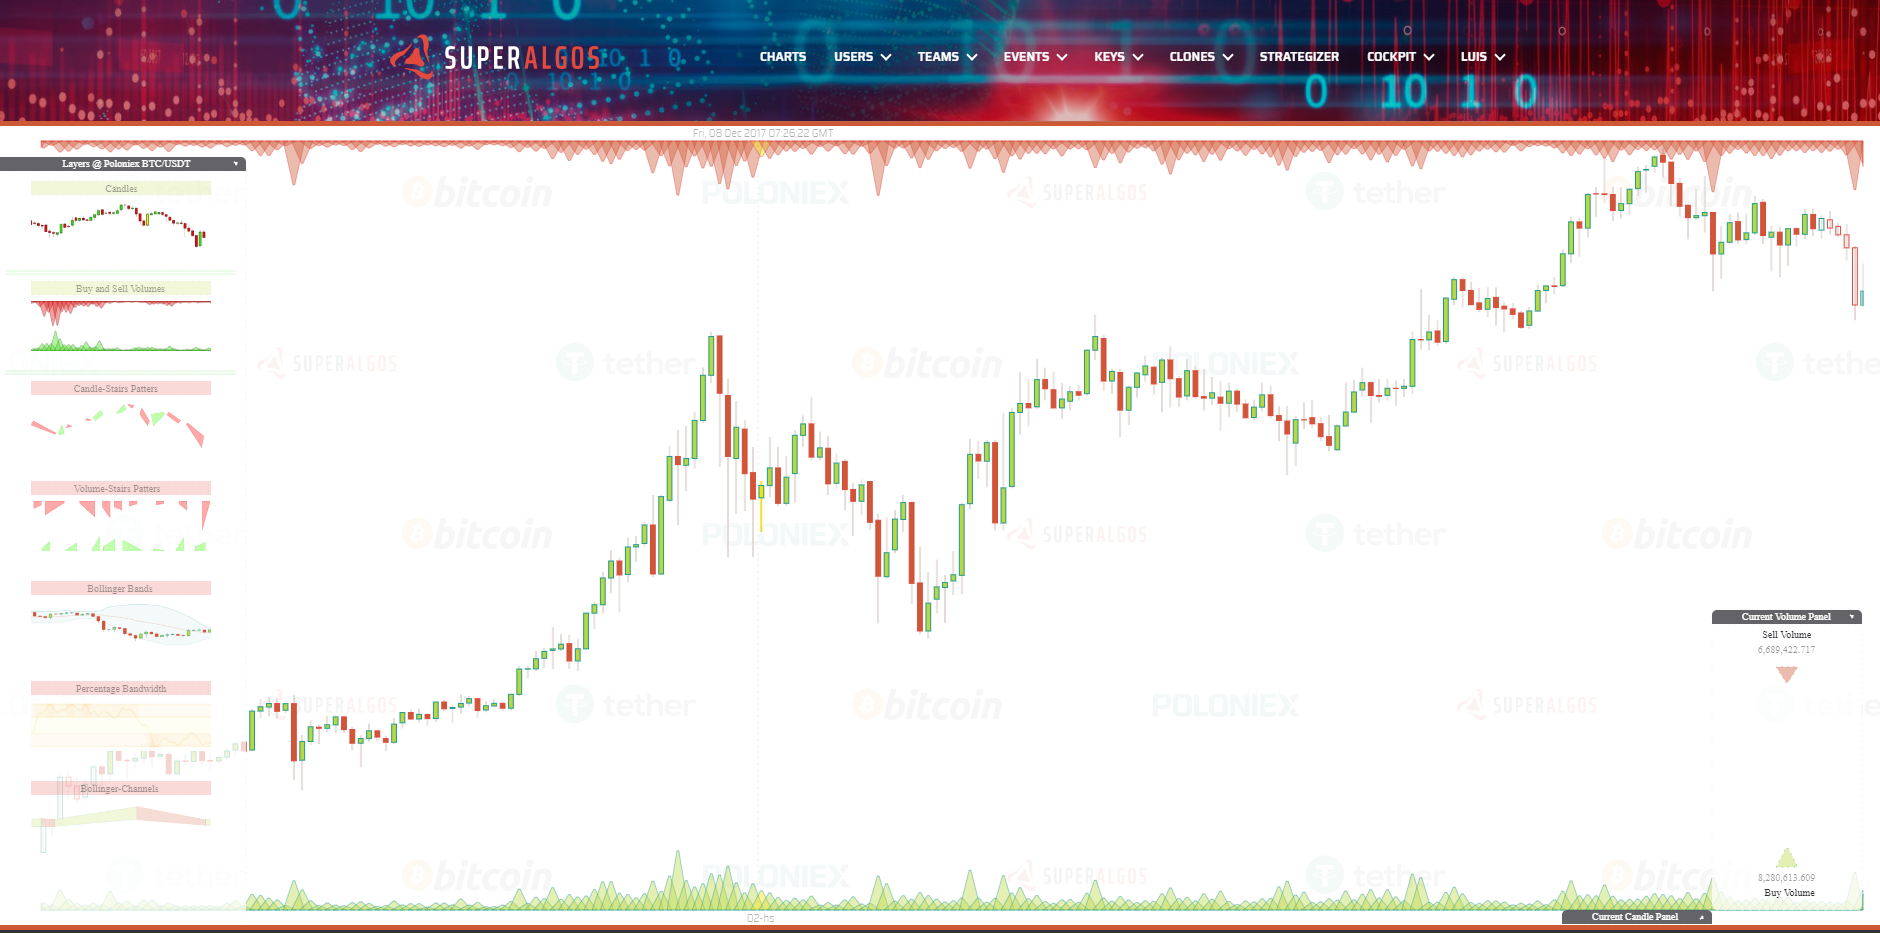
- Candle Stairs Patterns: this is an unusual pattern to prove anything can be added to the system. A Stair Pattern is defined as a set of candles going in the same direction, either up or down. You can think about this patterns as "Candle Channels" as are channels with direction up or down based on underlaying candles direction.
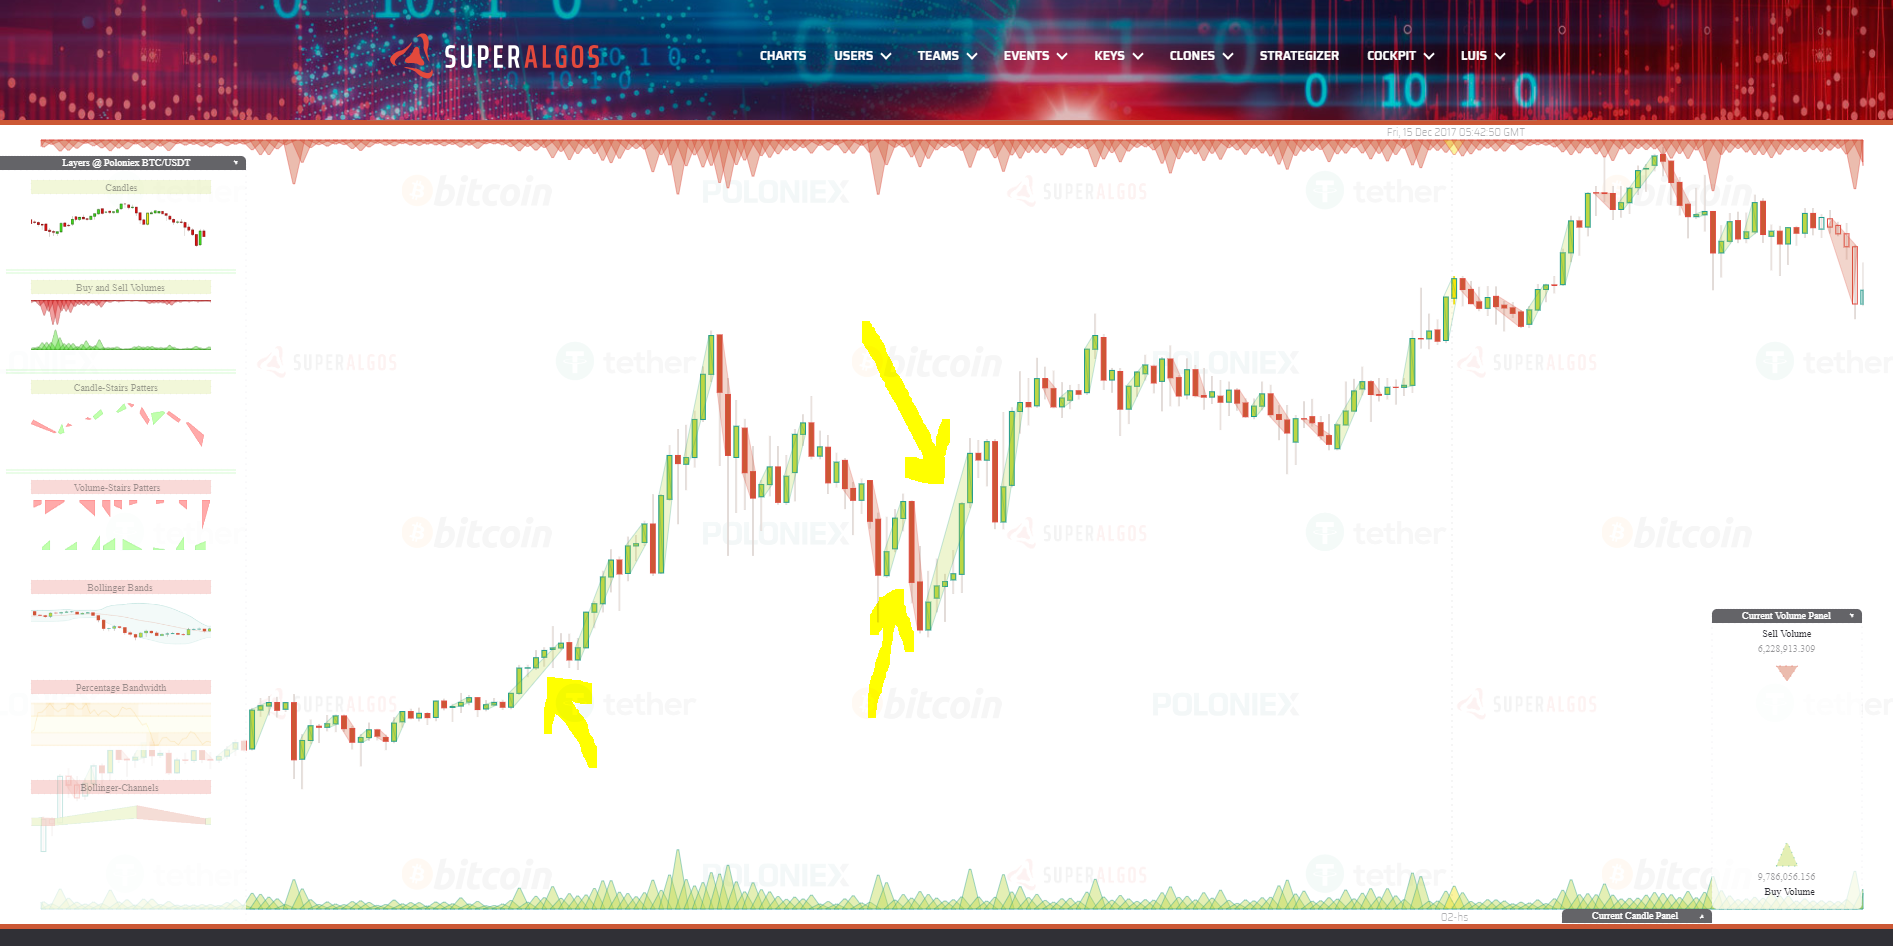
- Volume Stairs Patterns: similar concept but with volumes. Whenever we find a sequence of volume bars each one bigger than the previous one, they are bundled together in a "Stair". The same when they are going down (or the next is smaller than the previous one). In this way you can ask easily ask from a trading bot: is sell volume going up? is buy volume going down?
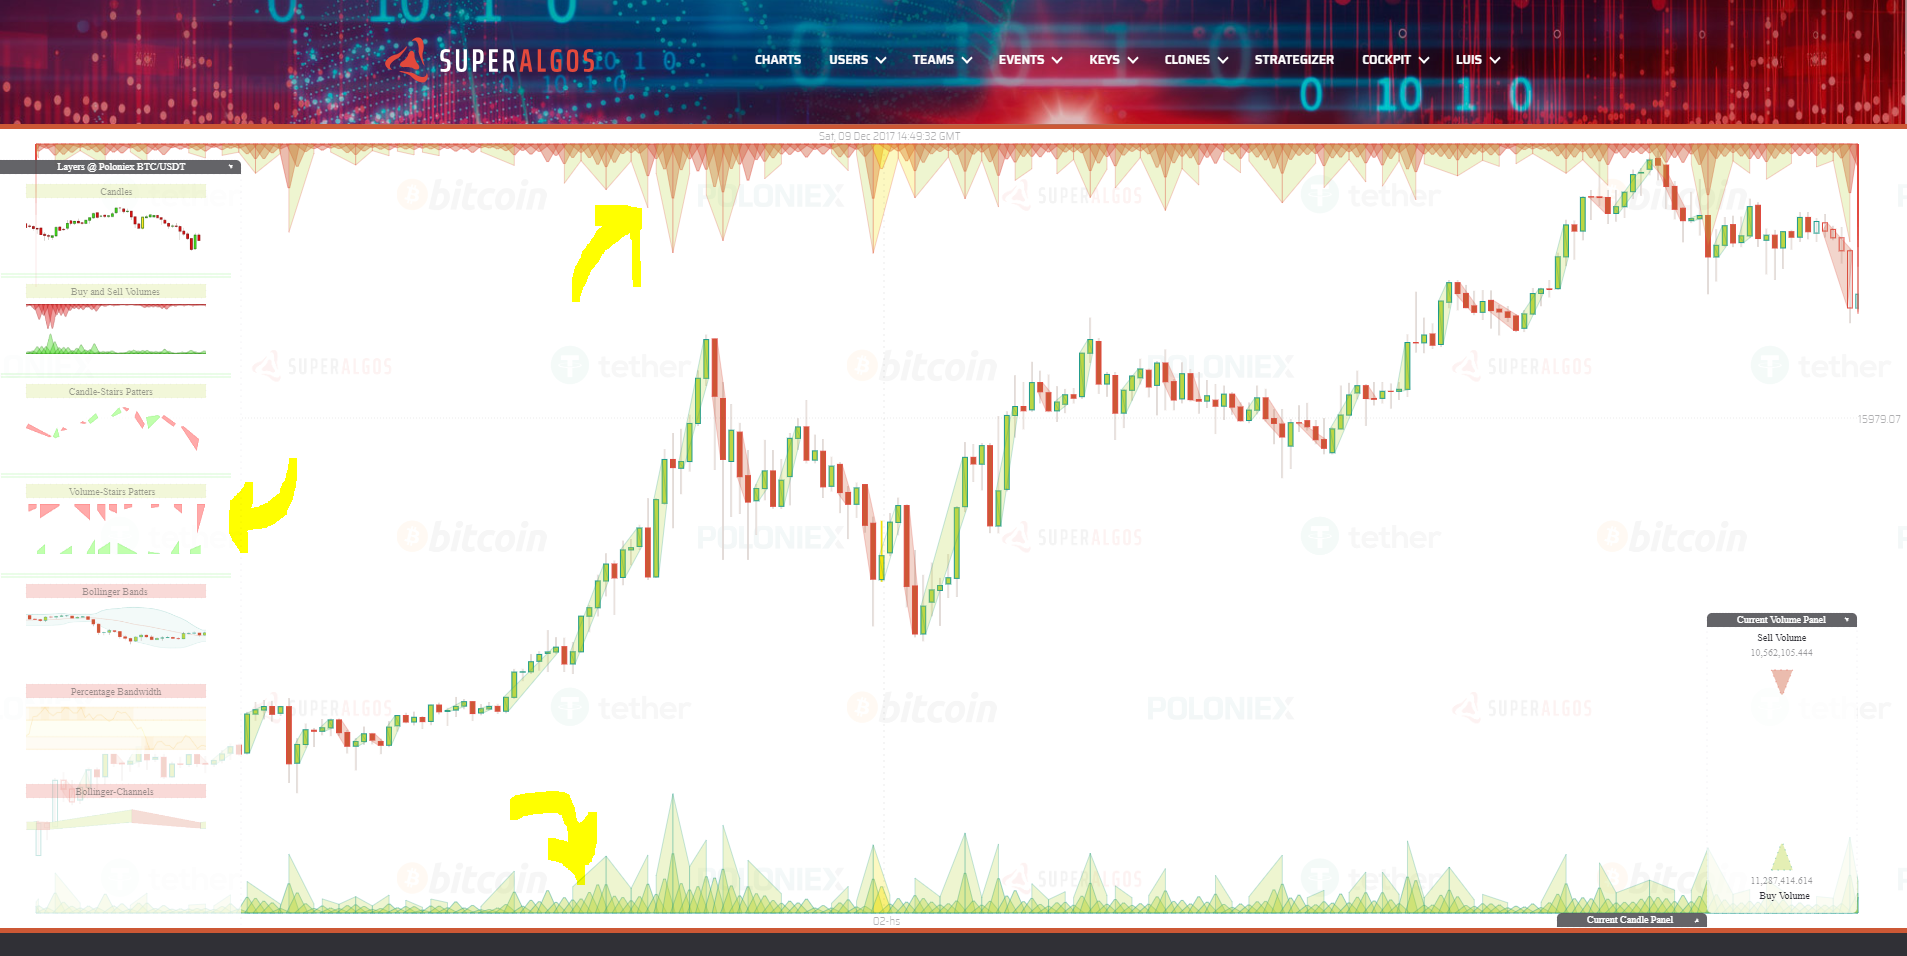
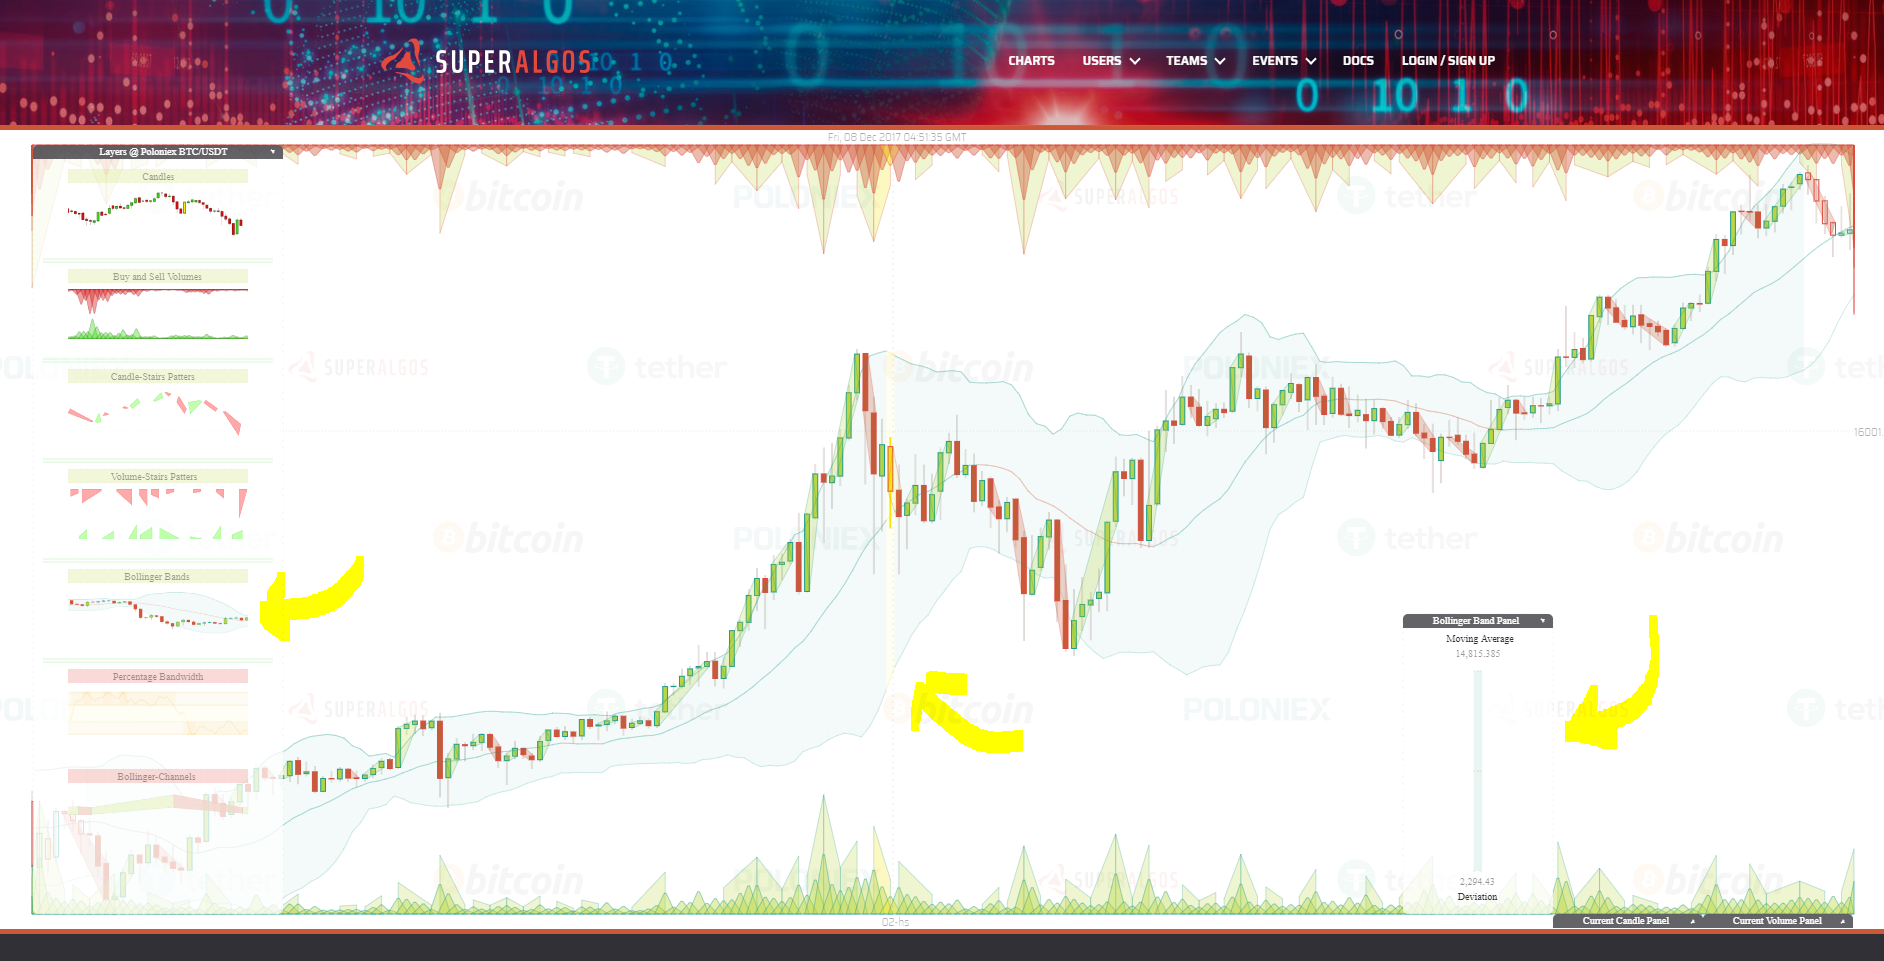
- Bollinger Bands: this is the traditional Bollinger Bands indicator as described here: https://en.wikipedia.org/wiki/Bollinger_Bands
Bollinger Bands have a moving average, in our case calculated with the last 20 periods. (It is the line in the middle of the bands.). We are plotting the moving average with one color when it is going up, and another color when it is going down. The upper band is at 2 Standard Deviations from the center and the lower band too, at 2 Standard Deviations. It is the most widely used Bollinger Bands settings.