
4.8 KiB
title, summary, sidebar, permalink
| title | summary | sidebar | permalink |
|---|---|---|---|
| Simulation Layers | suite_sidebar | suite-simulation-layers.html |
Introduction
| Layers Manager |
|---|
 |
The layers manager allows you to determine which visualization layers will be available at the Layers Panel to plot the results of testing sessions over the charts.
The layers manager and its offspring nodes must be visible in the Designer
Back on the charts, the following layers plot strategies' actions over the market data, providing a comprehensive set of visual clues showing how strategies would behave when trading.
NOTE: The examples below illustrate the Weak-hands Buster strategy, designed to sell BTC as prices start dropping and re-buy BTC as prices stabilize at a lower level.
Simulation
The Simulation layer displays the actions of strategies throughout the tested period. Actions include the take position event and the management of stop and take profit in phases. By activating the Simulation layer you should be able to see something like this:

Notice Asset Balances in the bottom left corner of the screen. Asset A represents BTC while Asset B represents USDT.
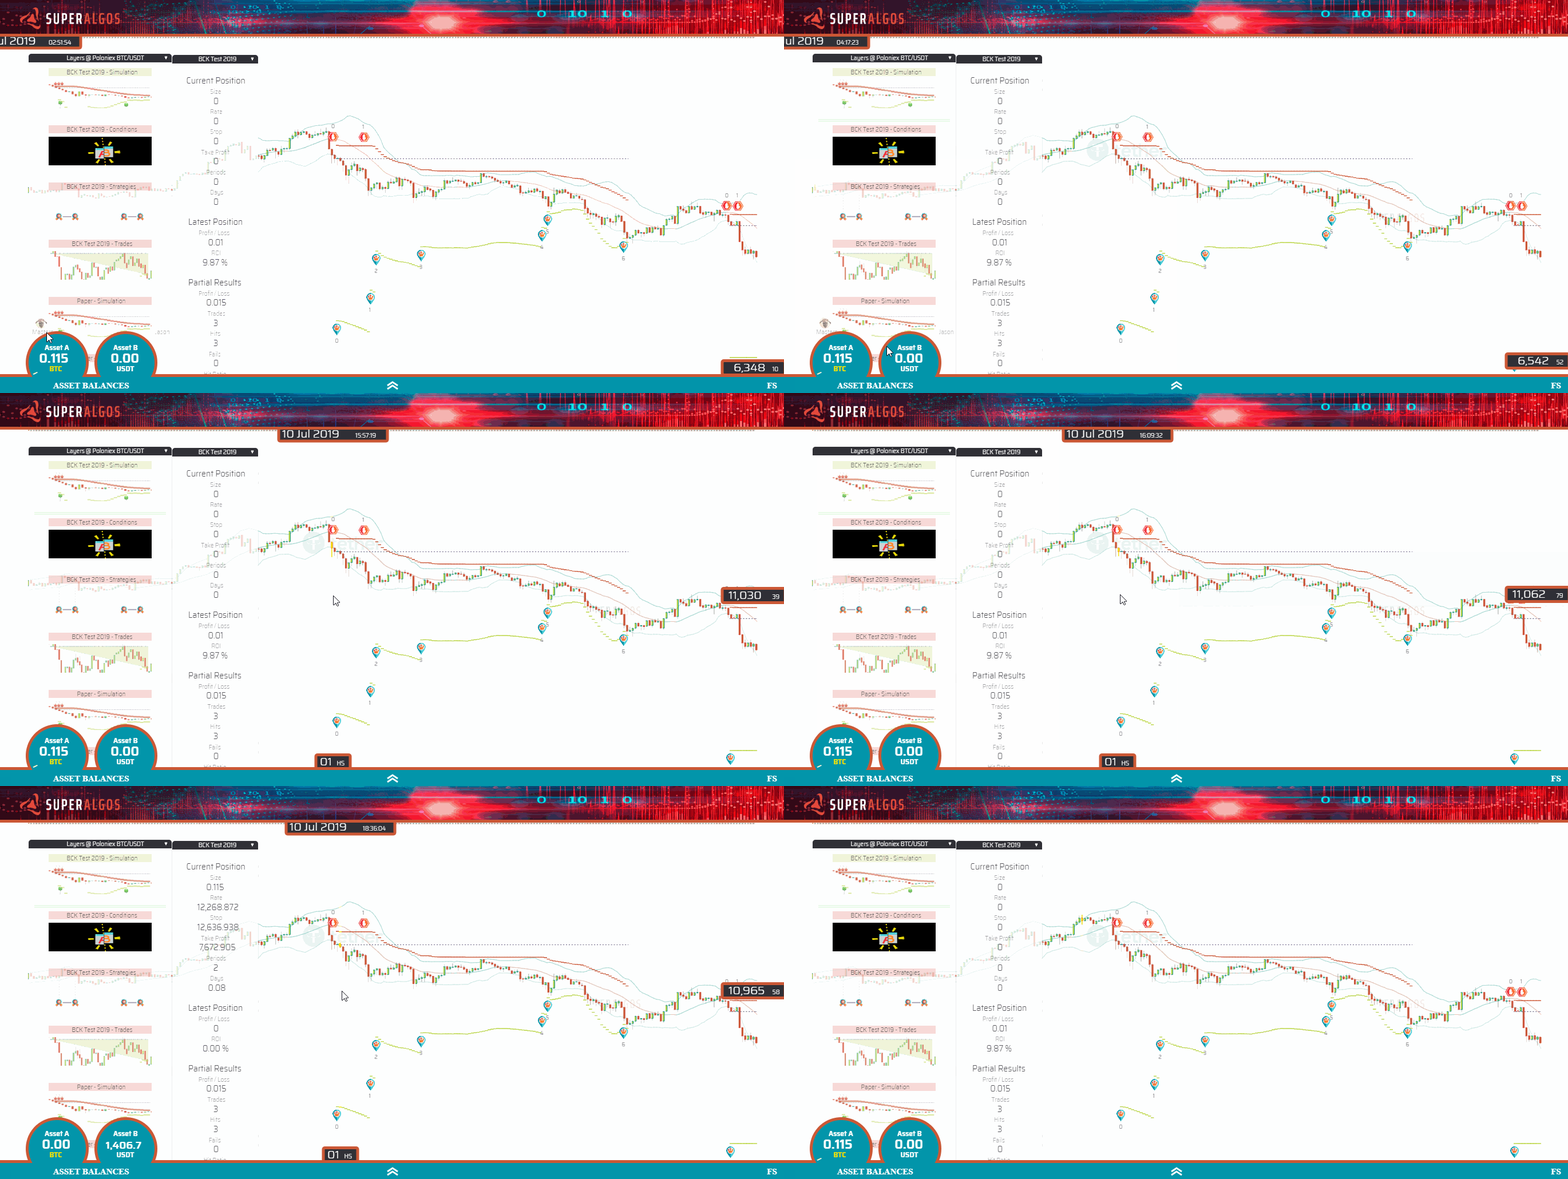
NOTE: For the time being, asset balances displayed on-screen correspond to the Simulation layer that was turned on last.
The dashed line represents the duration of the trade at the price of the take position event. Notice how one asset is exchanged for the other asset at the take position event, and exchanged back as the trade closes.
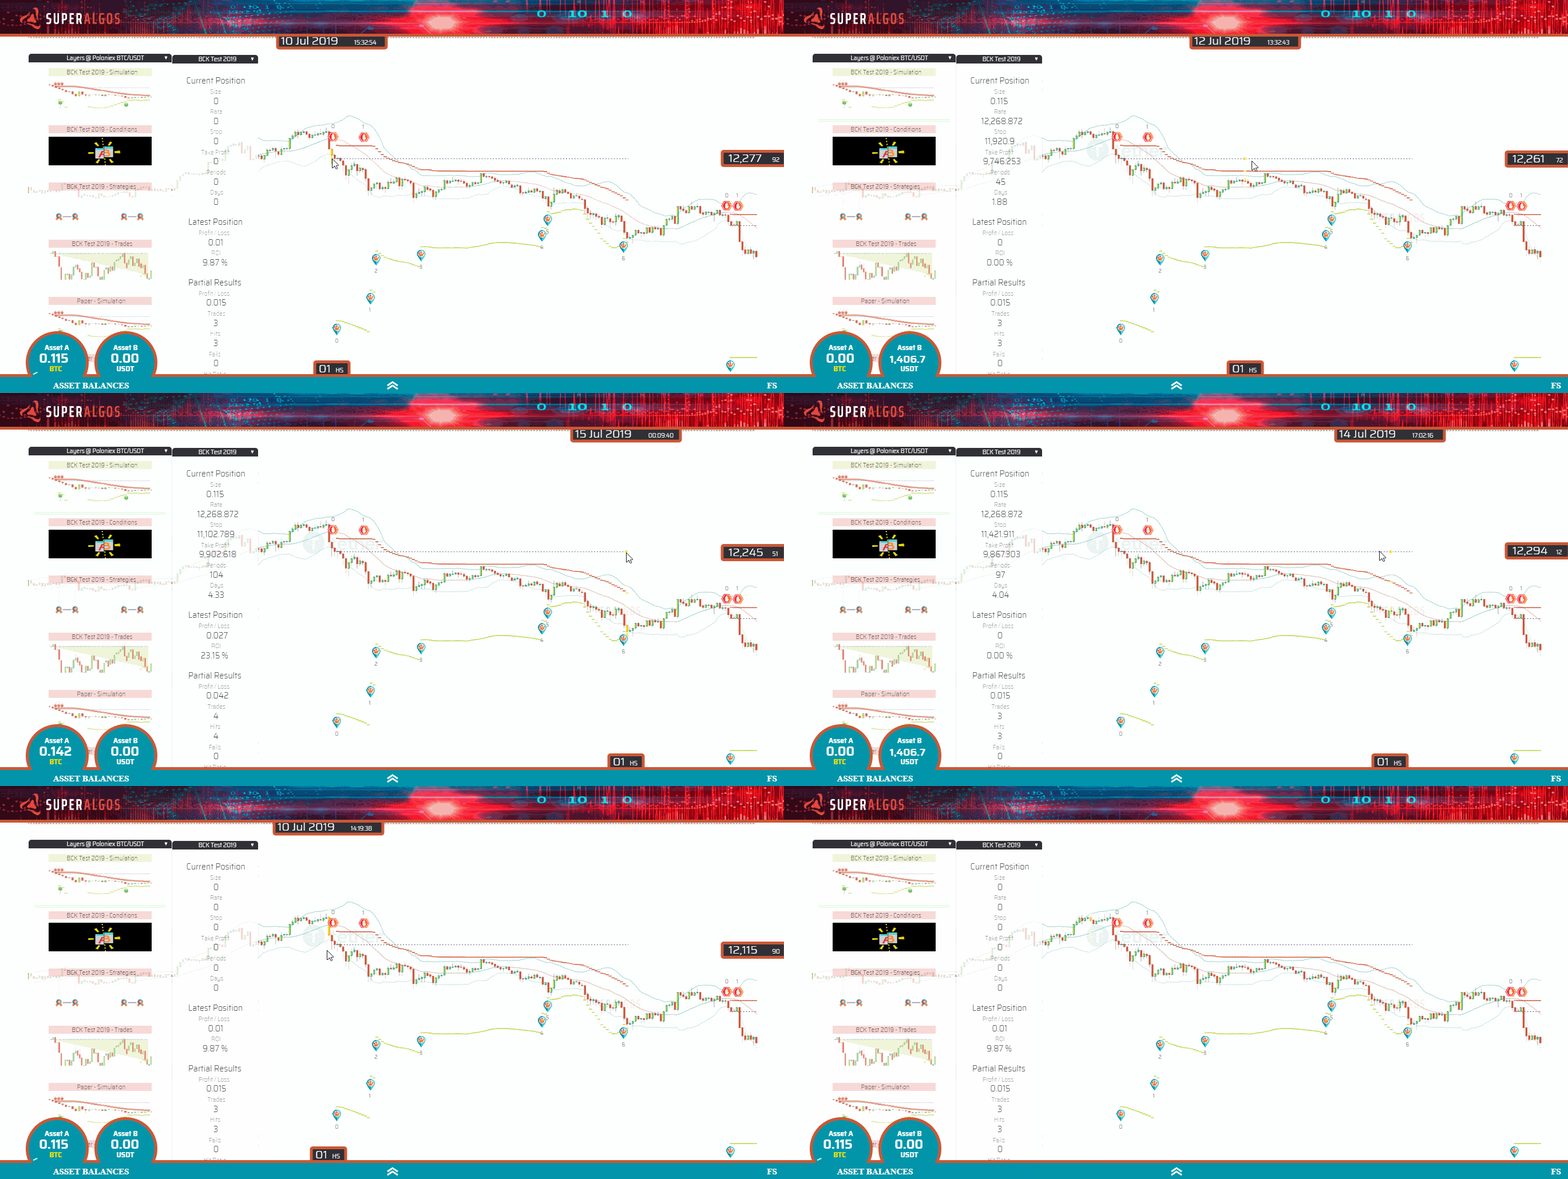
Notice the green horizontal lines indicating the take profit value for each period (candle). Take profit is managed in phases, marked with the corresponding icons.

Notice the red horizontal lines indicating the stop value for each period (candle). Stop is managed in phases marked with the corresponding icons.

Formulas and Conditions
The Formulas and Conditions layer helps identify which conditions are met at each candle. Notice how conditions are highlighted as the mouse pointer moves through different candles.

It also allows to track the value of each formula, for instance, those used to dynamically manage take profit in phases.

Strategies
The Strategies layer identifies trigger on and trigger off events, signaling the activation and deactivation of strategies.

Trades
The Trades layer marks trades with a triangle whose hypotenuse connects the price at the take position event with the exit price. When the trade is profitable, the triangle is green; when the exit happens at a loss, the triangle is red.
