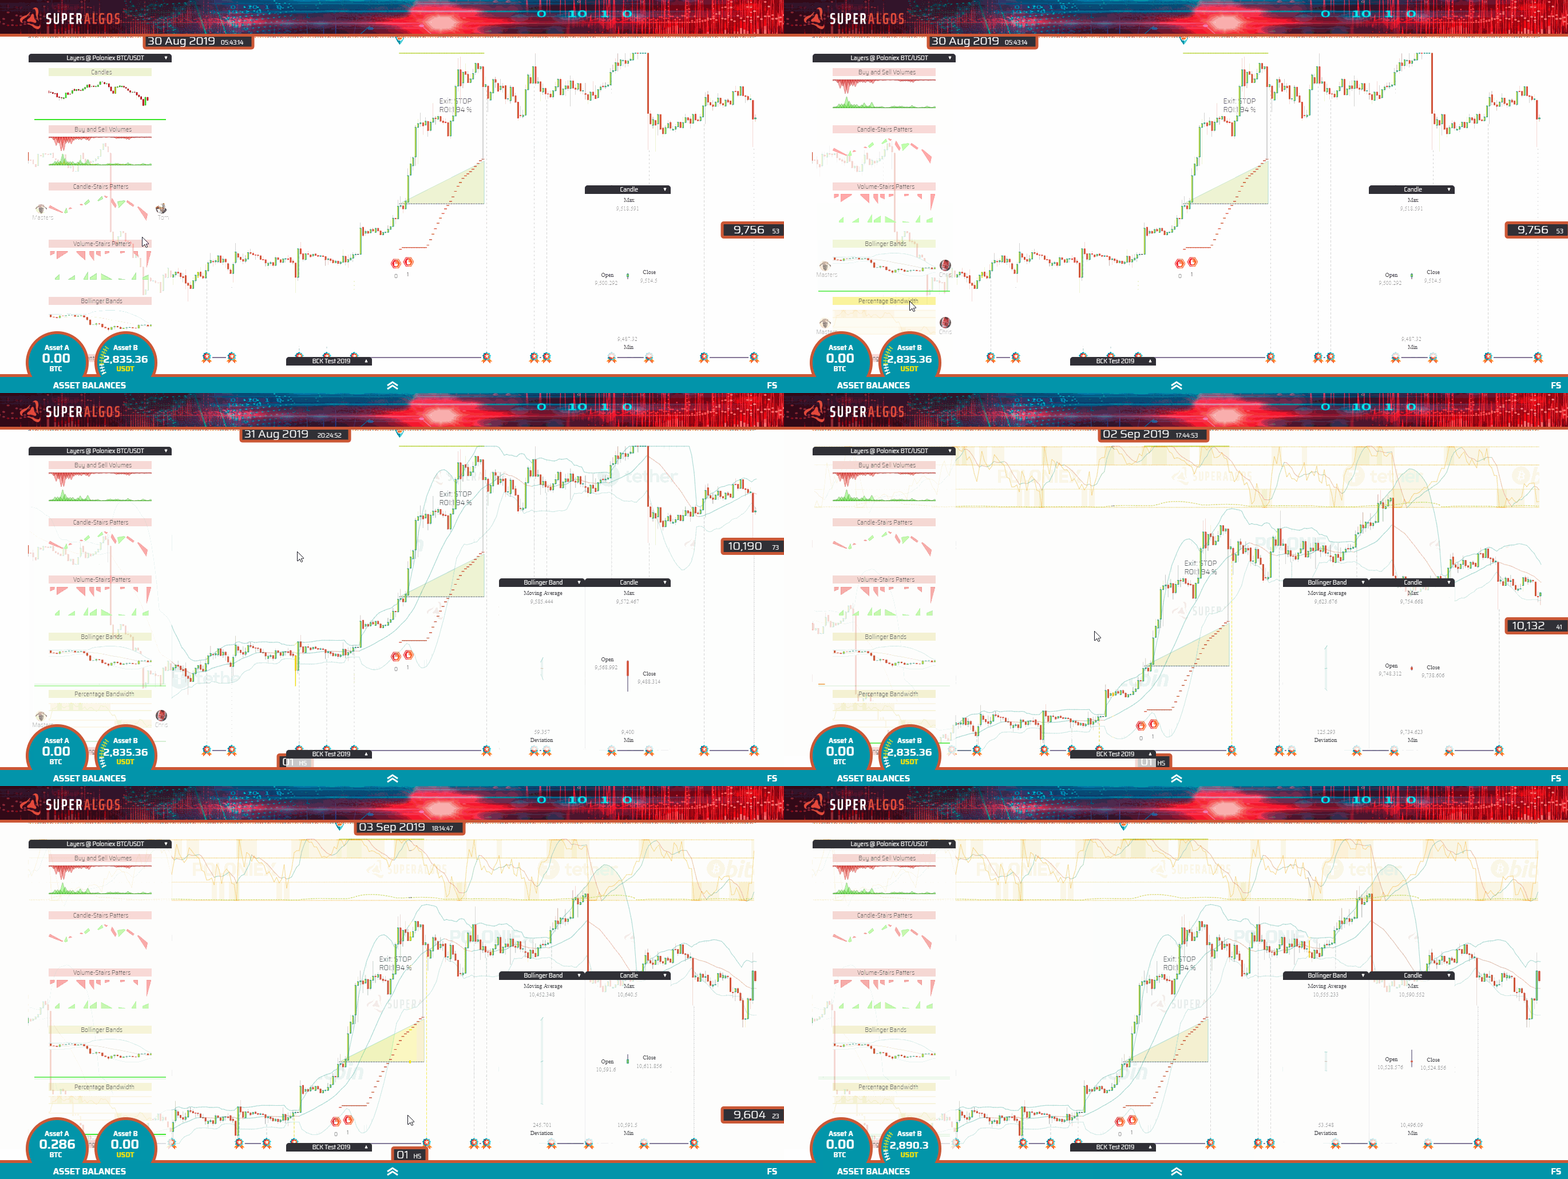
2.6 KiB
title, summary, sidebar, permalink
| title | summary | sidebar | permalink |
|---|---|---|---|
| Quick Overview | suite_sidebar | suite-quick-overview.html |
Start here: Watch the Superalgos Platform Quick Getting Started Guide video for a quick intro. The video is slightly outdated in that the Superalgos Platform (the client version of the Platform) does not require a login and does not feature a menu on top. Otherwise, the content is still valid.
The first time you run the platform, you will see a screen split in half. The top half features the space used by the Charts and the bottom half features the Designer.
Use the control in the center of the turquoise bar to pull the bar up and down to make more room for either application.
You may also use your keyboard as follows:
- Alt + ↑ to close the Charts and open the Designer.
- Alt + ↓ to close the Designer and open the Charts.
- Alt + → to set the bar at the middle giving half of the screen to the Charts and the other half to the Designer.
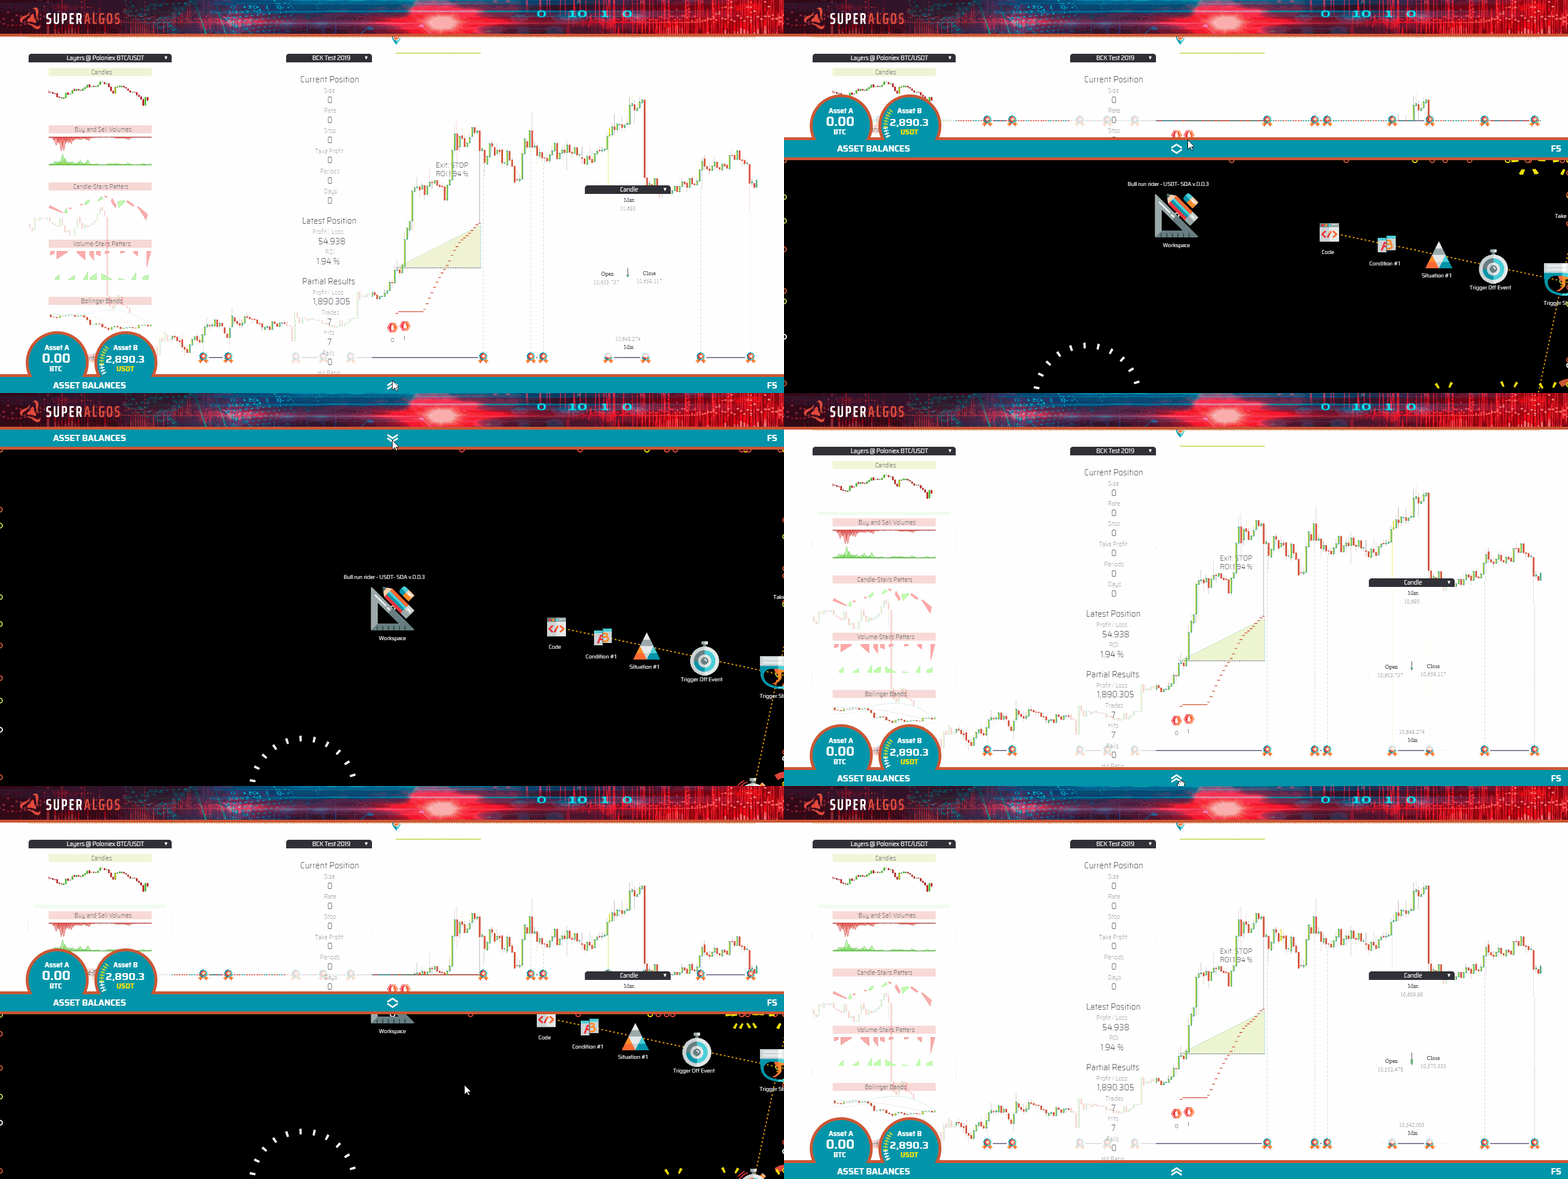
TIP: Pulling the bar to the very top of the screen causes the Charts to stop consuming resources in your machine, and gives you an ample view of the Designer.
The Designer is the place where you create. Think of the designer as your toolbox. This is where you will control every aspect of your data, your trading strategies and the overall behavior of the platform in general.
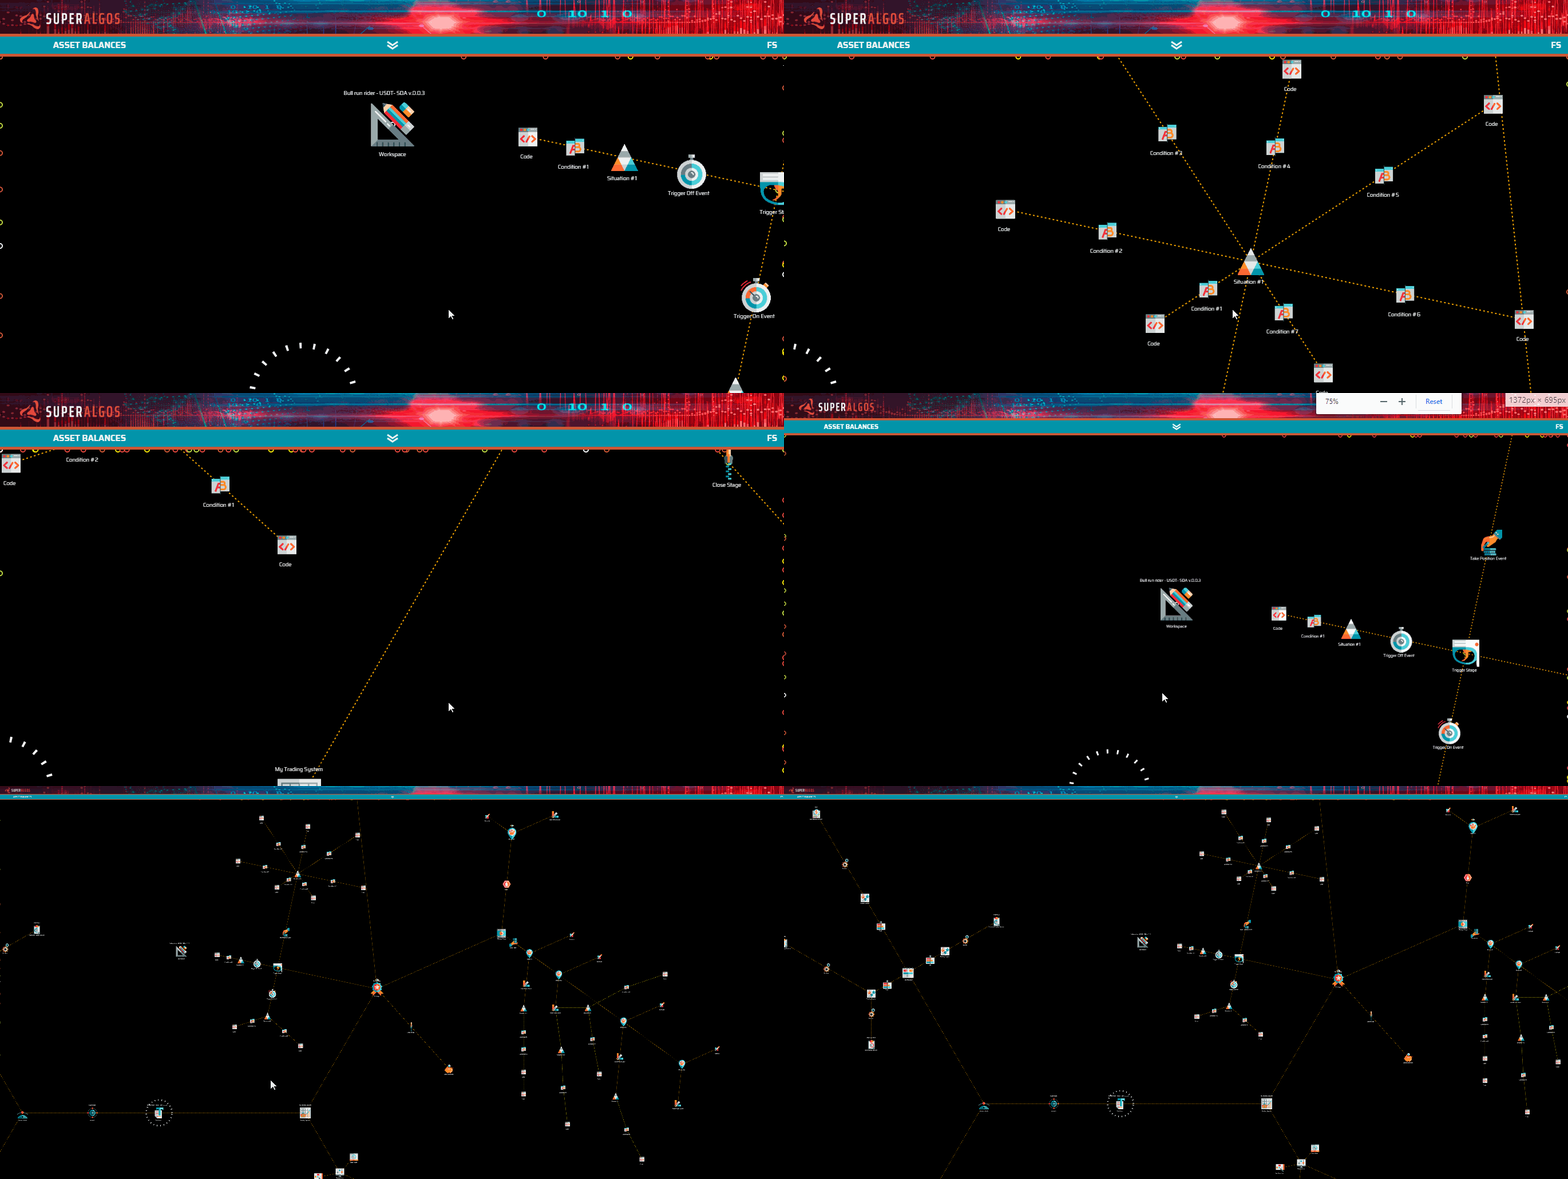
TIP: Pulling the bar to the very bottom of the screen causes the Designer to stop consuming resources from your machine and offers a full-screen view of the Charts. The image above shows what you will see once you import your first workspace (you will learn about it in the next step).
The Charts show indicators data along with the actions taken by strategies, integrated with market data. This is the section of the platform in which you will see and analyze the result of your work.