
10 KiB
title, summary, sidebar, permalink
| title | summary | sidebar | permalink |
|---|---|---|---|
| Layers Panel | suite_sidebar | suite-layers-panel.html |
Indicators Included in the Data Release
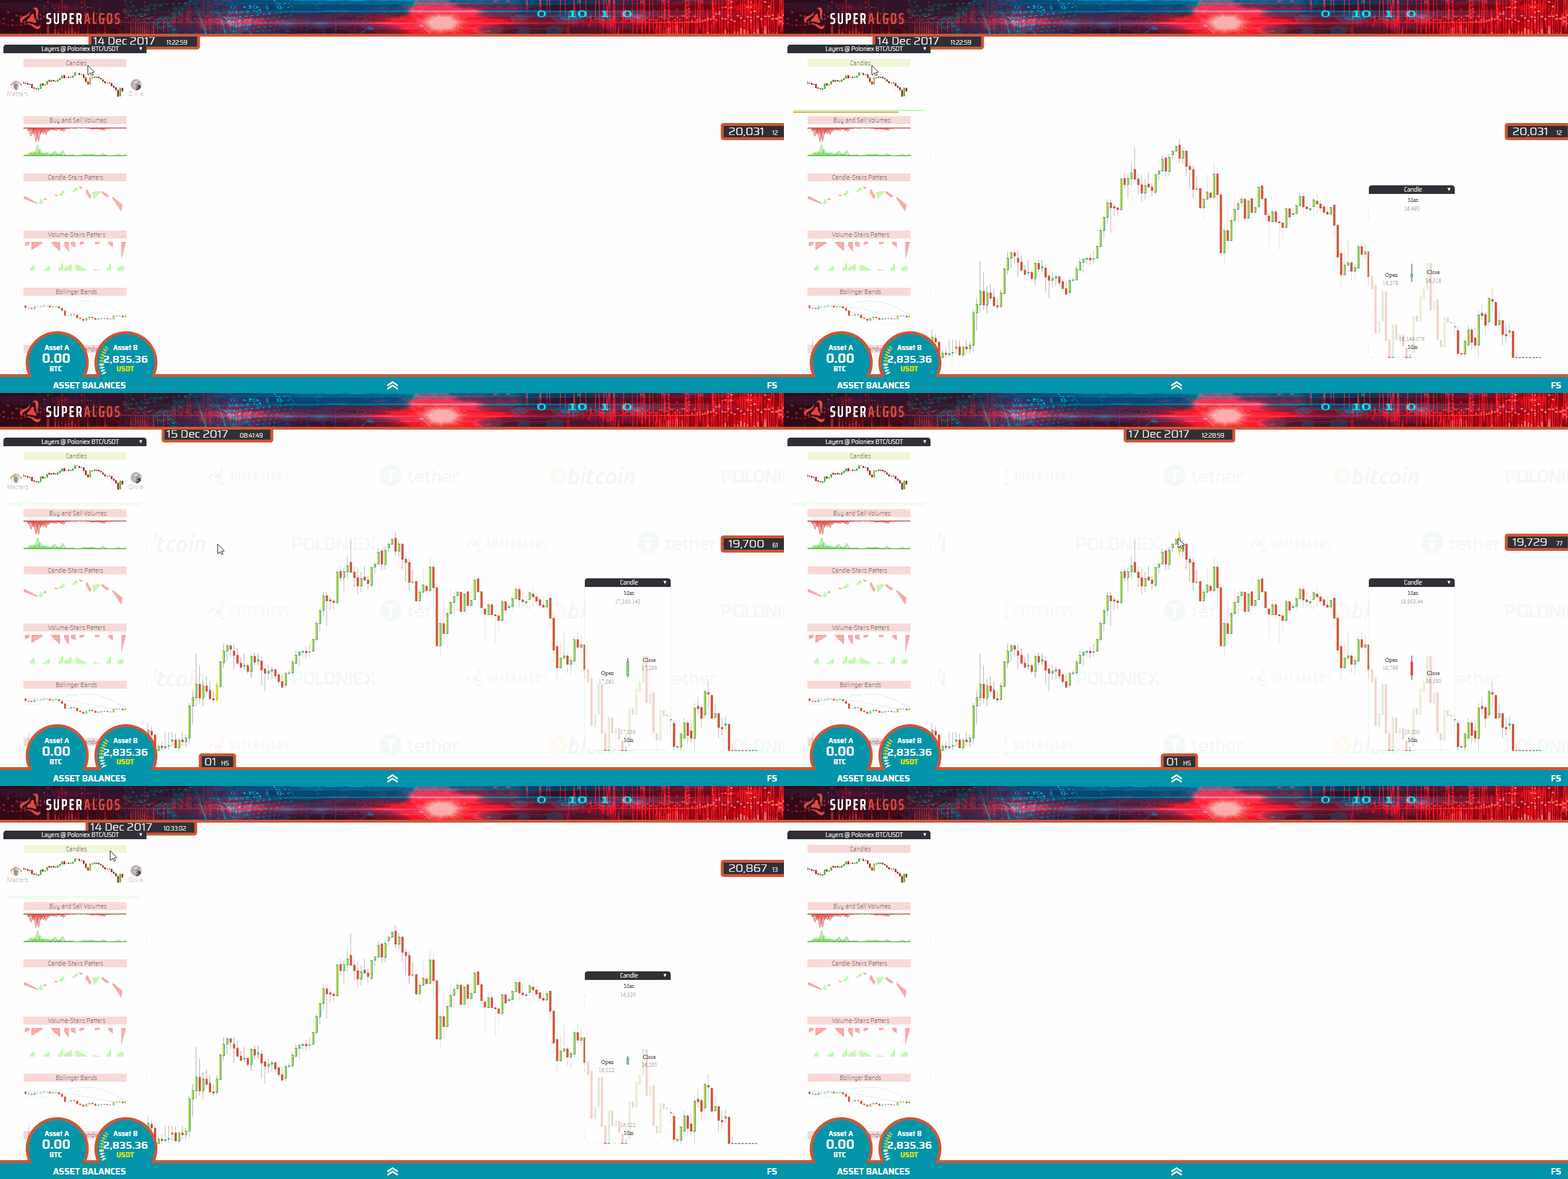
Candles
Typical candlesticks.
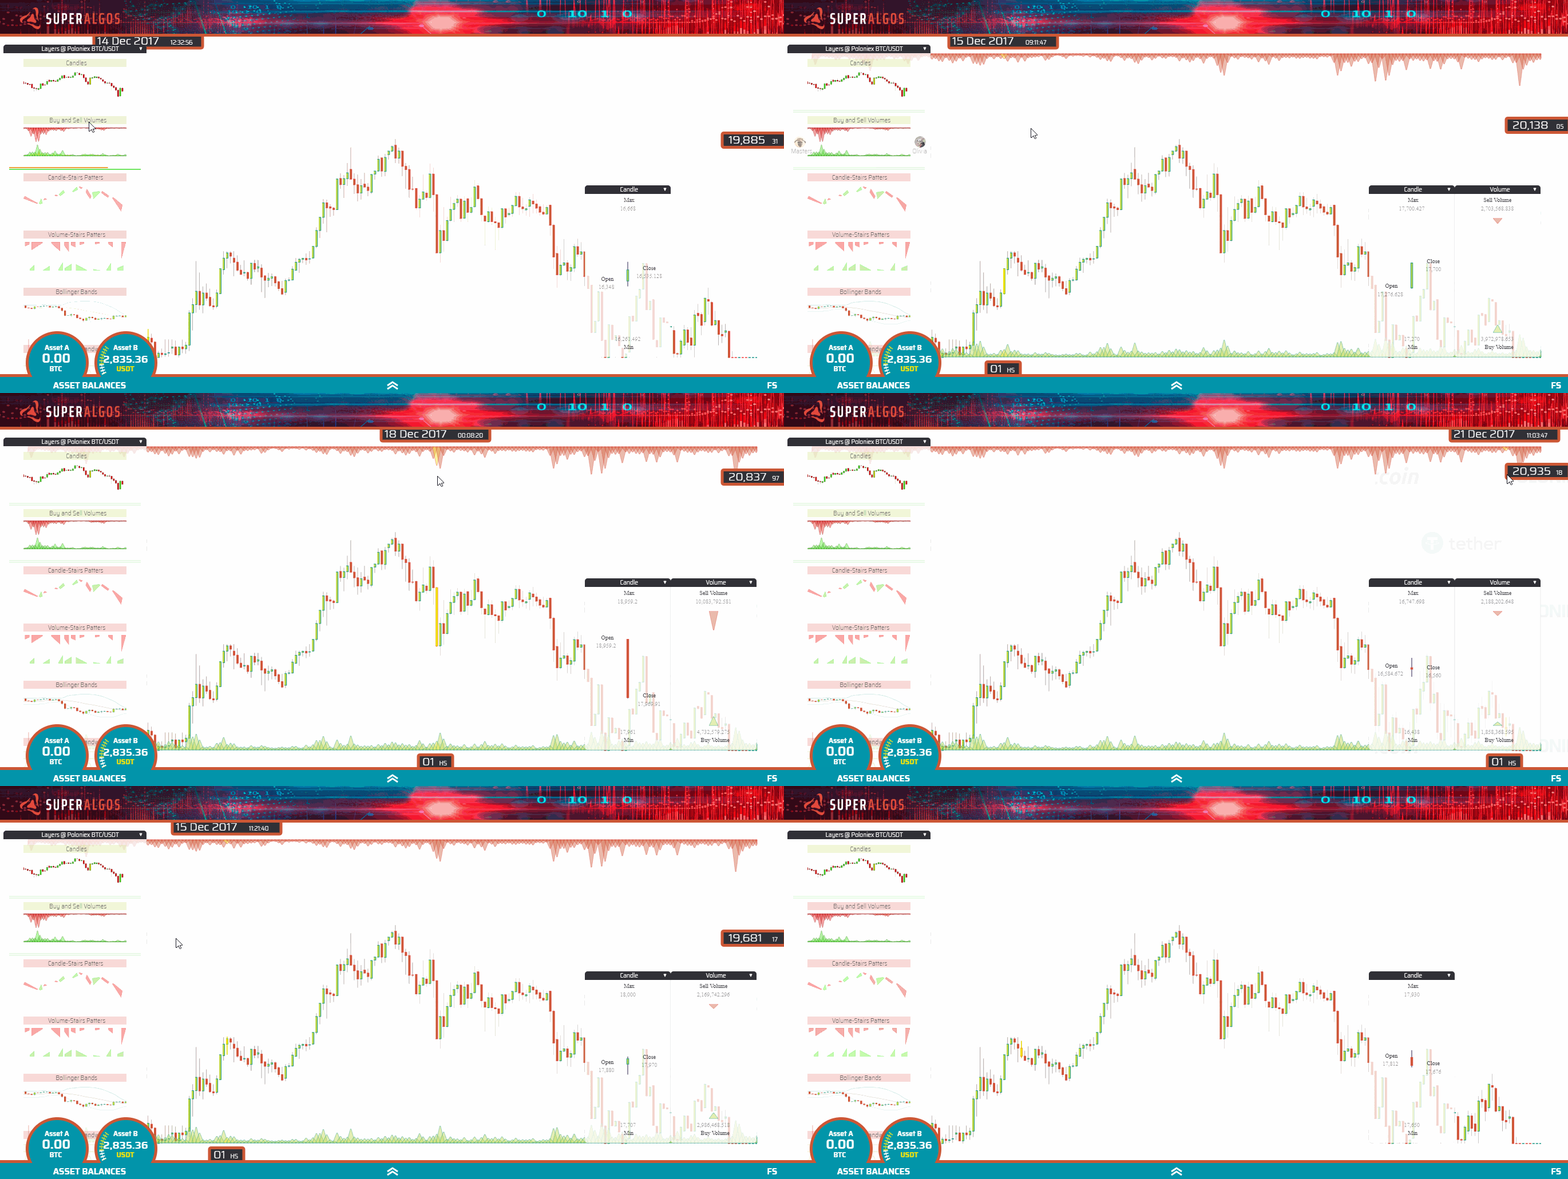
Volumes
We innovated a bit placing the buy volume at the bottom (in green), and the sell volume at the top (in red).
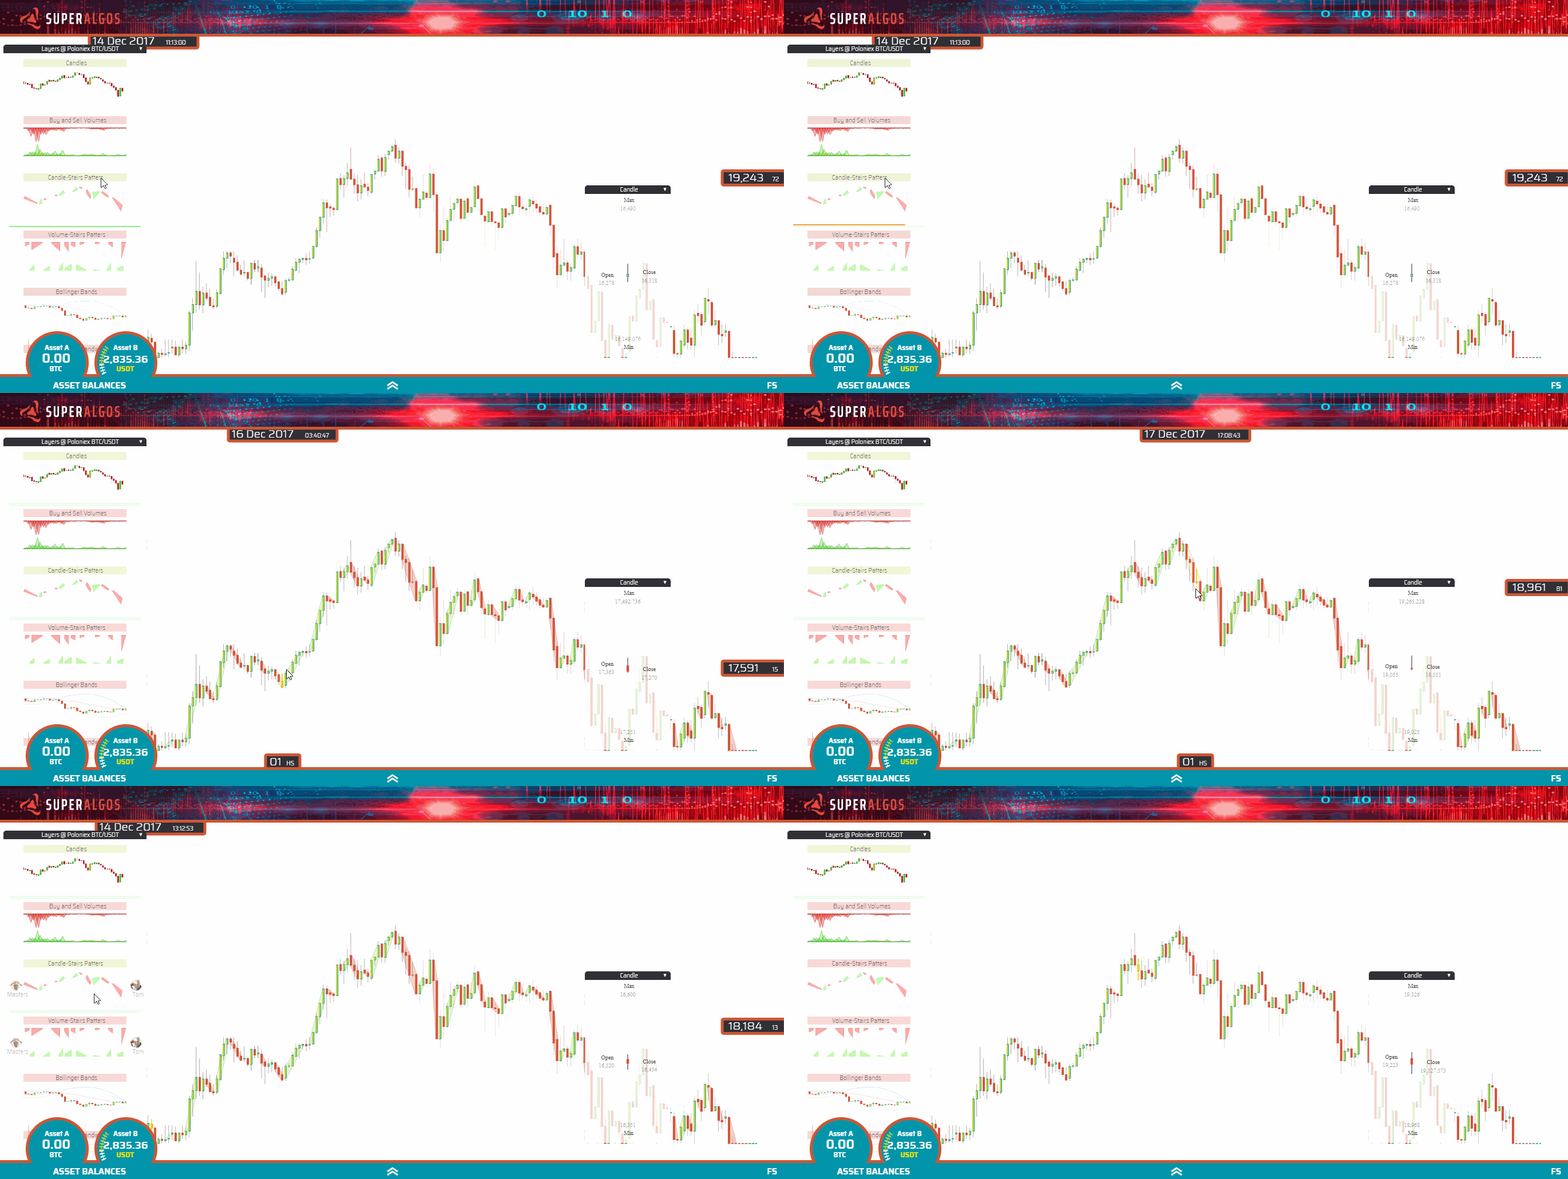
Candle Stairs Patterns
This is an unusual pattern proving any dataset may be plotted on the charts (and by extension, that anything can be added to the system). A Stair Pattern is defined as a set of candles going in the same direction, either up or down. You can think of these patterns as "Candle Channels", as they represent channels with an up or down direction based on underlying candles direction.
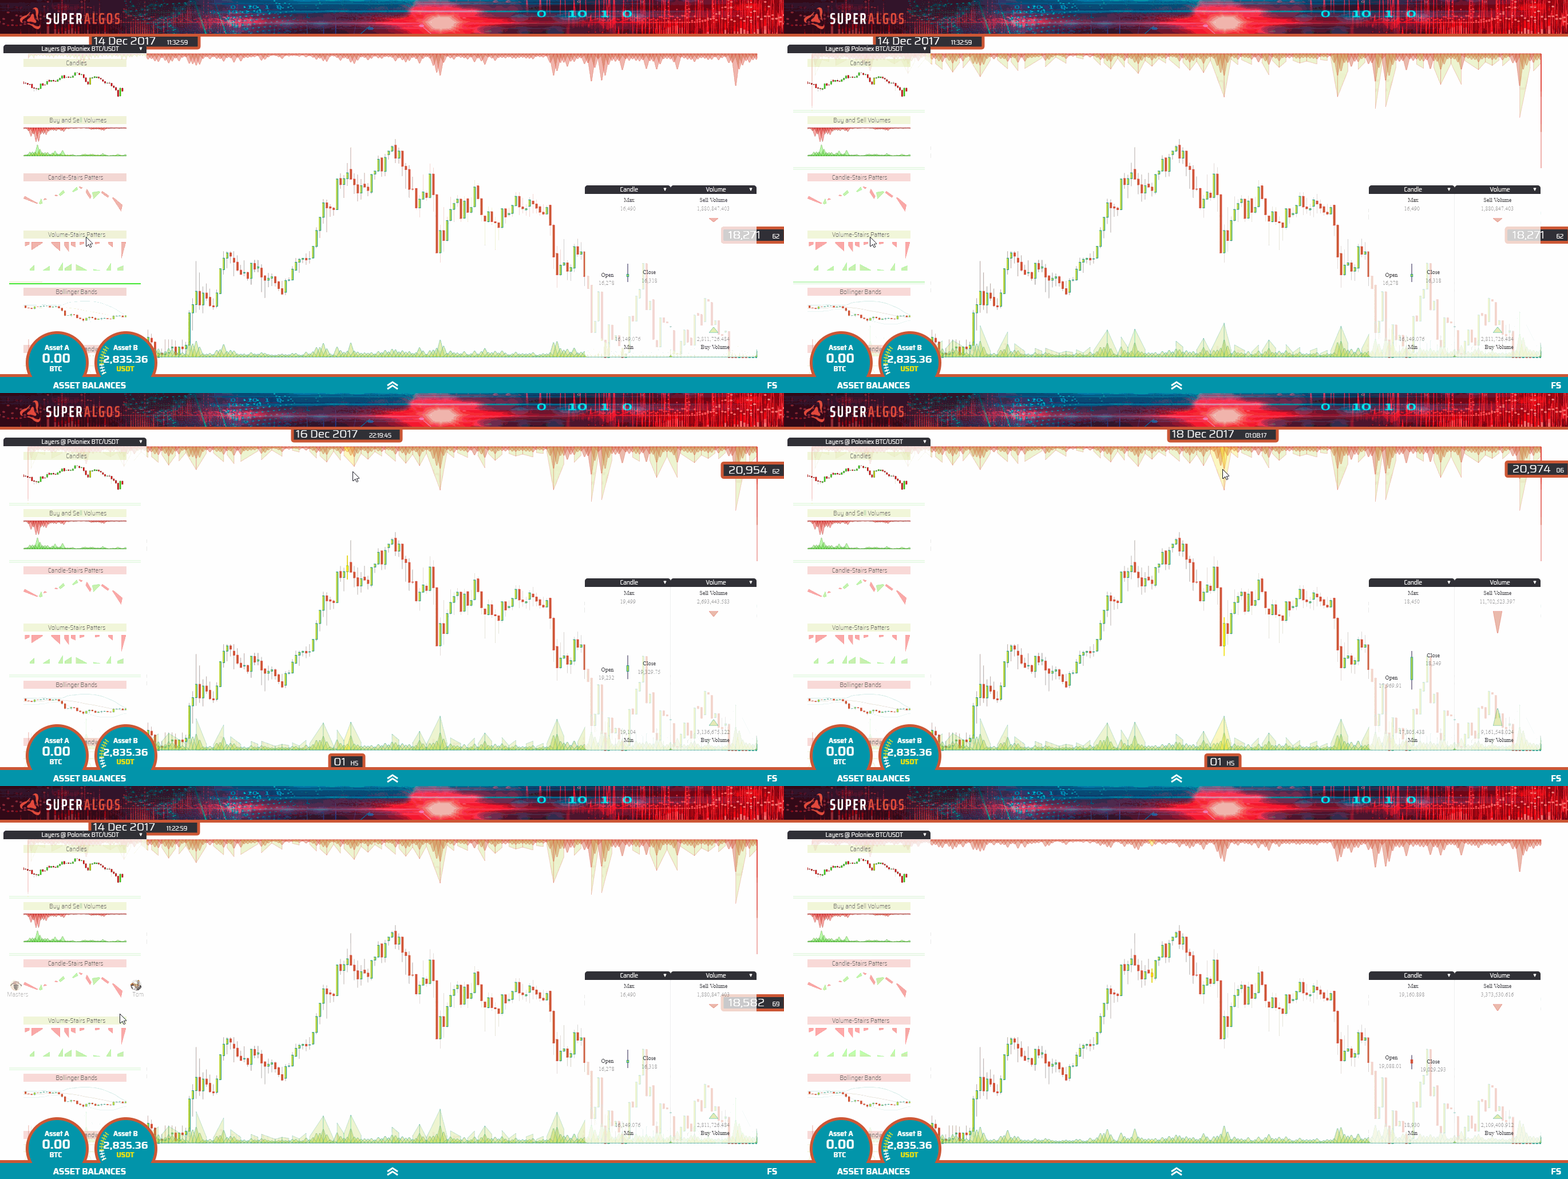
Volume Stairs Patterns
A similar concept, this time with volumes. Whenever a sequence of volume bars is found where each one is bigger than the previous one, they are bundled together in a "Stair". The same applies when they are going down (the next is smaller than the previous one). For a trading bot, this serves to identify if sell or buy volumes are rising or declining.
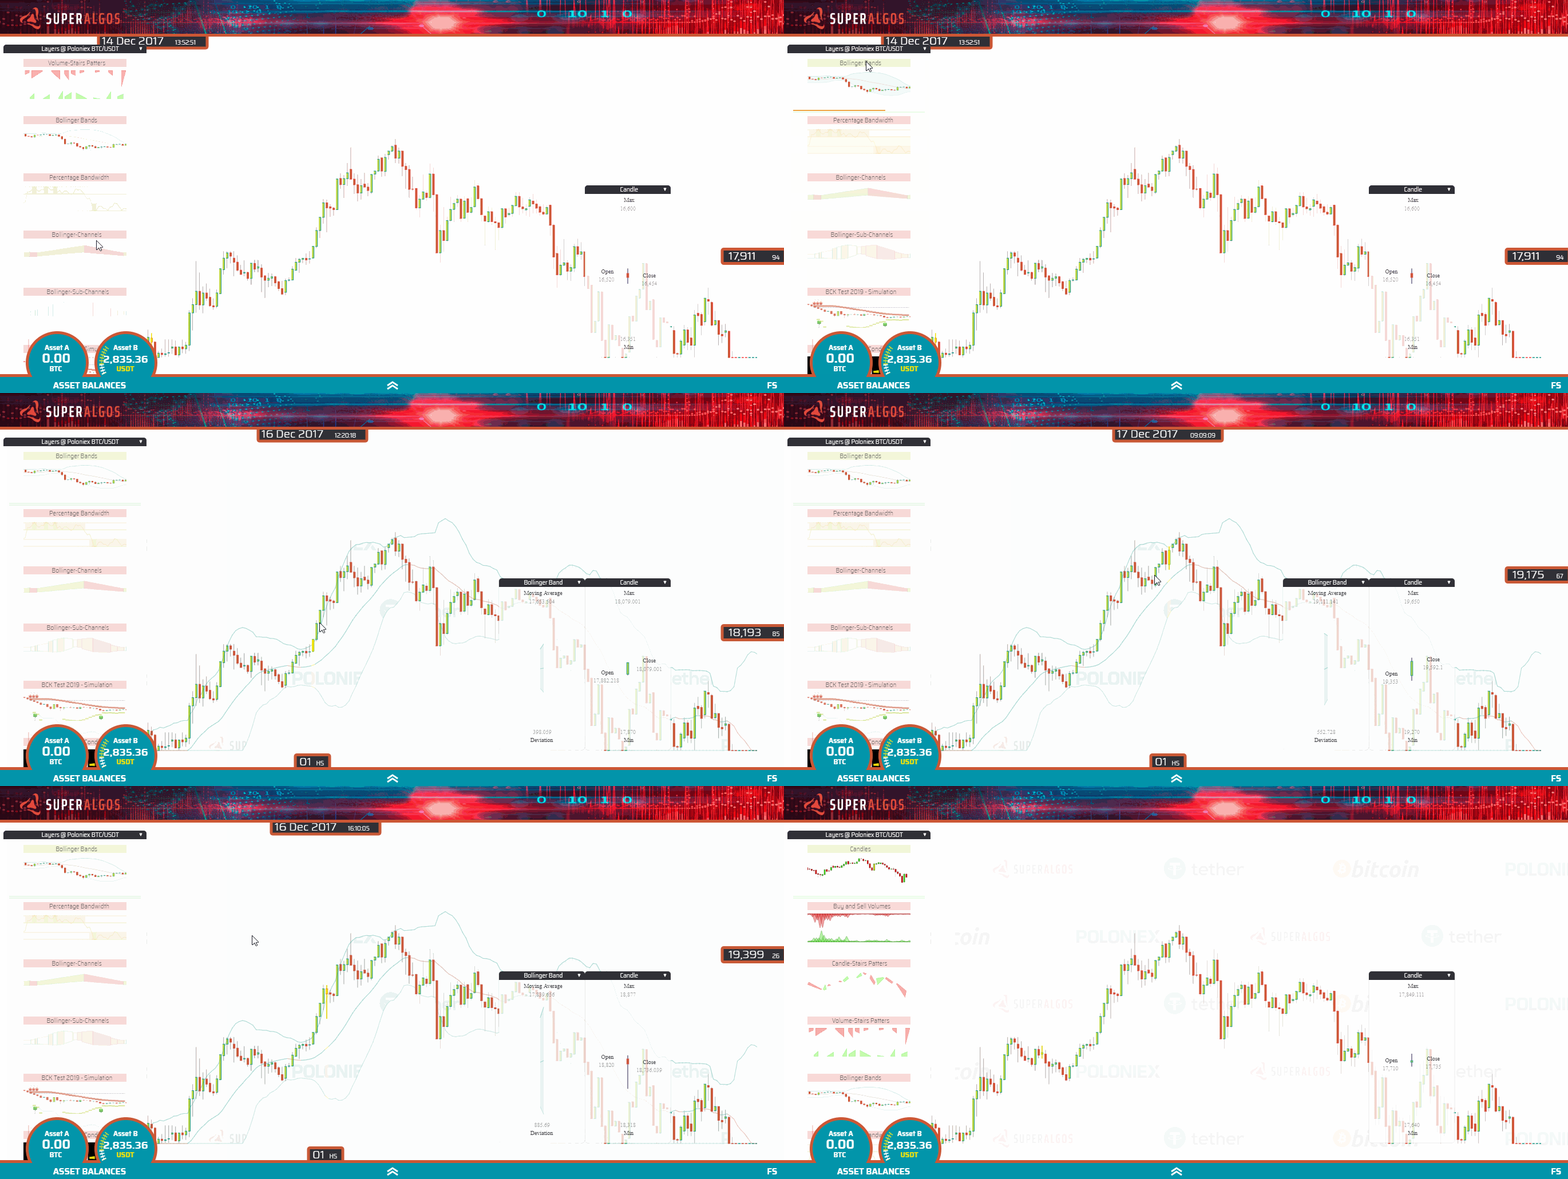
Bollinger Bands
This is the traditional Bollinger Bands indicator. Bollinger Bands have a moving average, in our case calculated with the last 20 periods (the line in the middle of the bands). We are plotting the moving average with one color when it is going up, and with a different color when it's going down. The upper band is at 2 Standard Deviations from the moving average, pretty much like the lower band, also at 2 Standard Deviations. These are the most widely used Bollinger Bands settings.
Percentage Bandwidth
This is a well-known indicator that derives from the Bollinger Bands. In a nutshell, it tells you how close the price is either to the upper band or the lower band at any point in time. When the price is in the middle of the bands (it is calculated with the close value of each candle), then %B is in the middle of its chart, at value 50. When the price touches the upper band, then %B is at 100, and finally when the price is at the lower band, then %B is at 0.
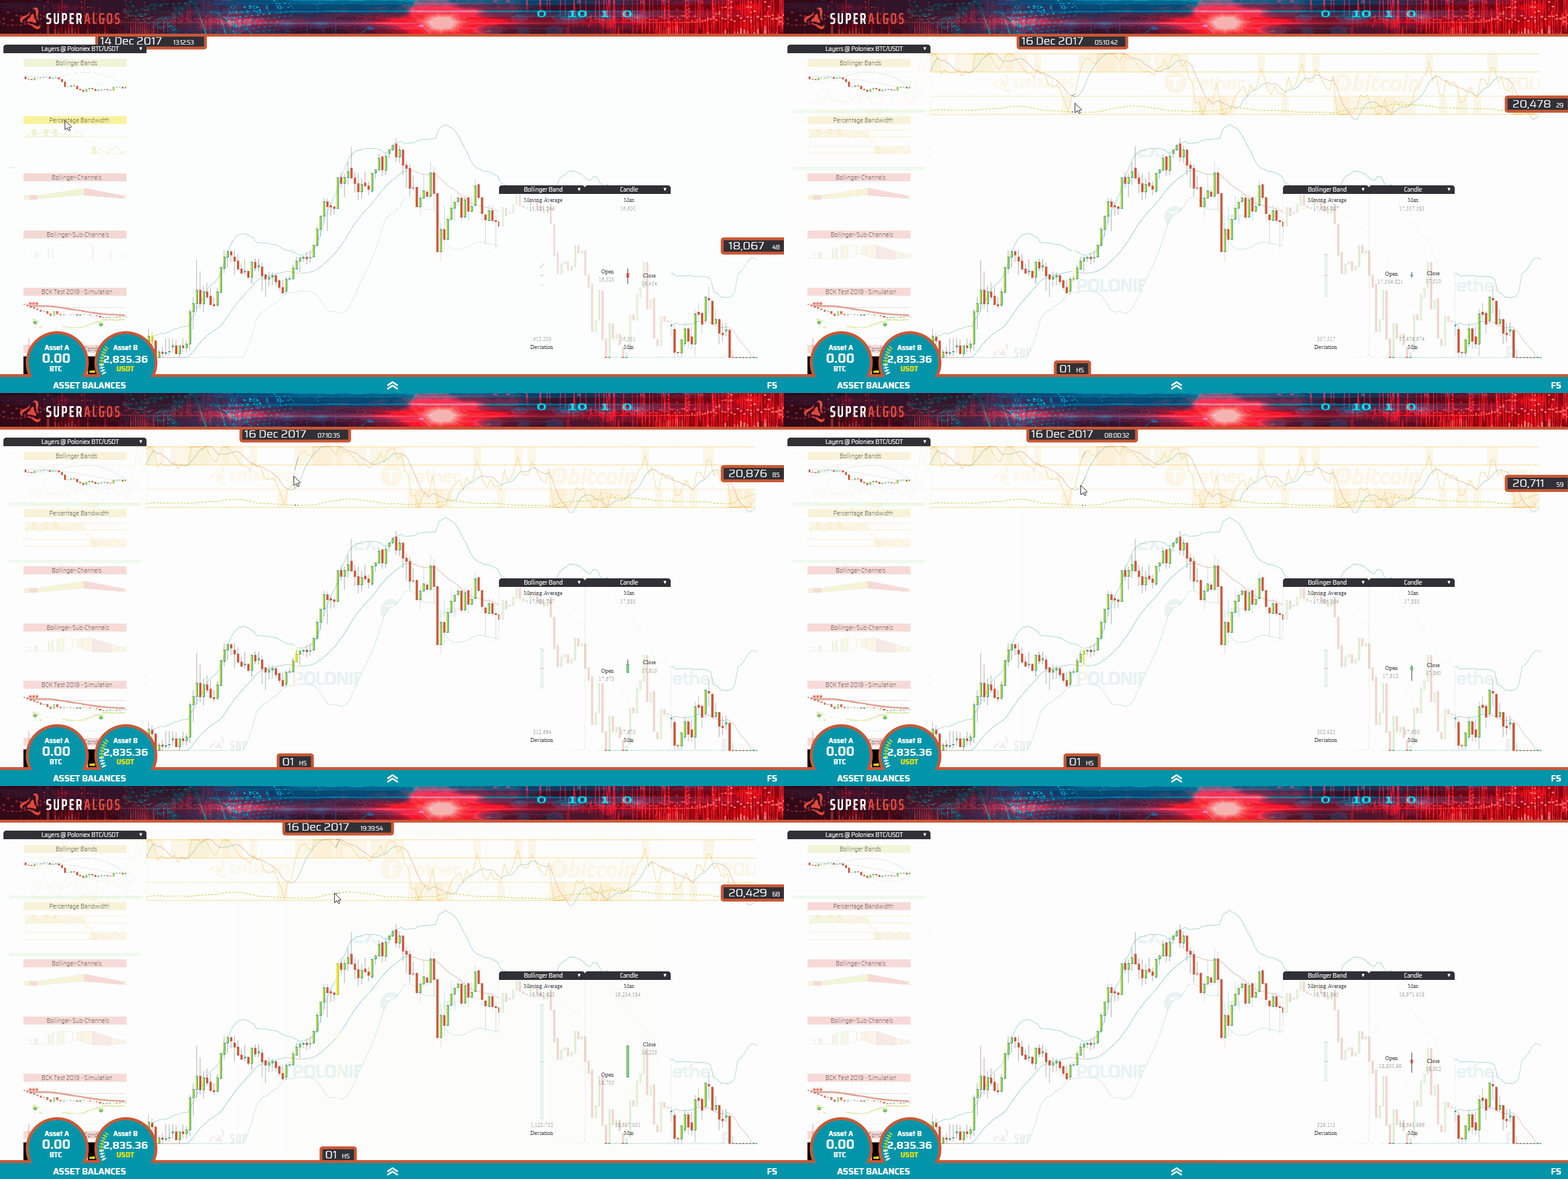
The chart features lines at %B values 30 and 70 since those are the most common values for traders to forecast when a reversal may happen. In our chart, %B is the one represented at #1. We've found useful to add a moving average to smooth volatility a bit and to be able to ask—at any time—if it is going up or down. The moving average calculated with the last 5 %B values is plotted as line #2. Finally, we've also added a property called Bandwidth, which represents the separation of the upper band from the lower band. It is a measure of volatility and is plotted at #3.
Bollinger Channels
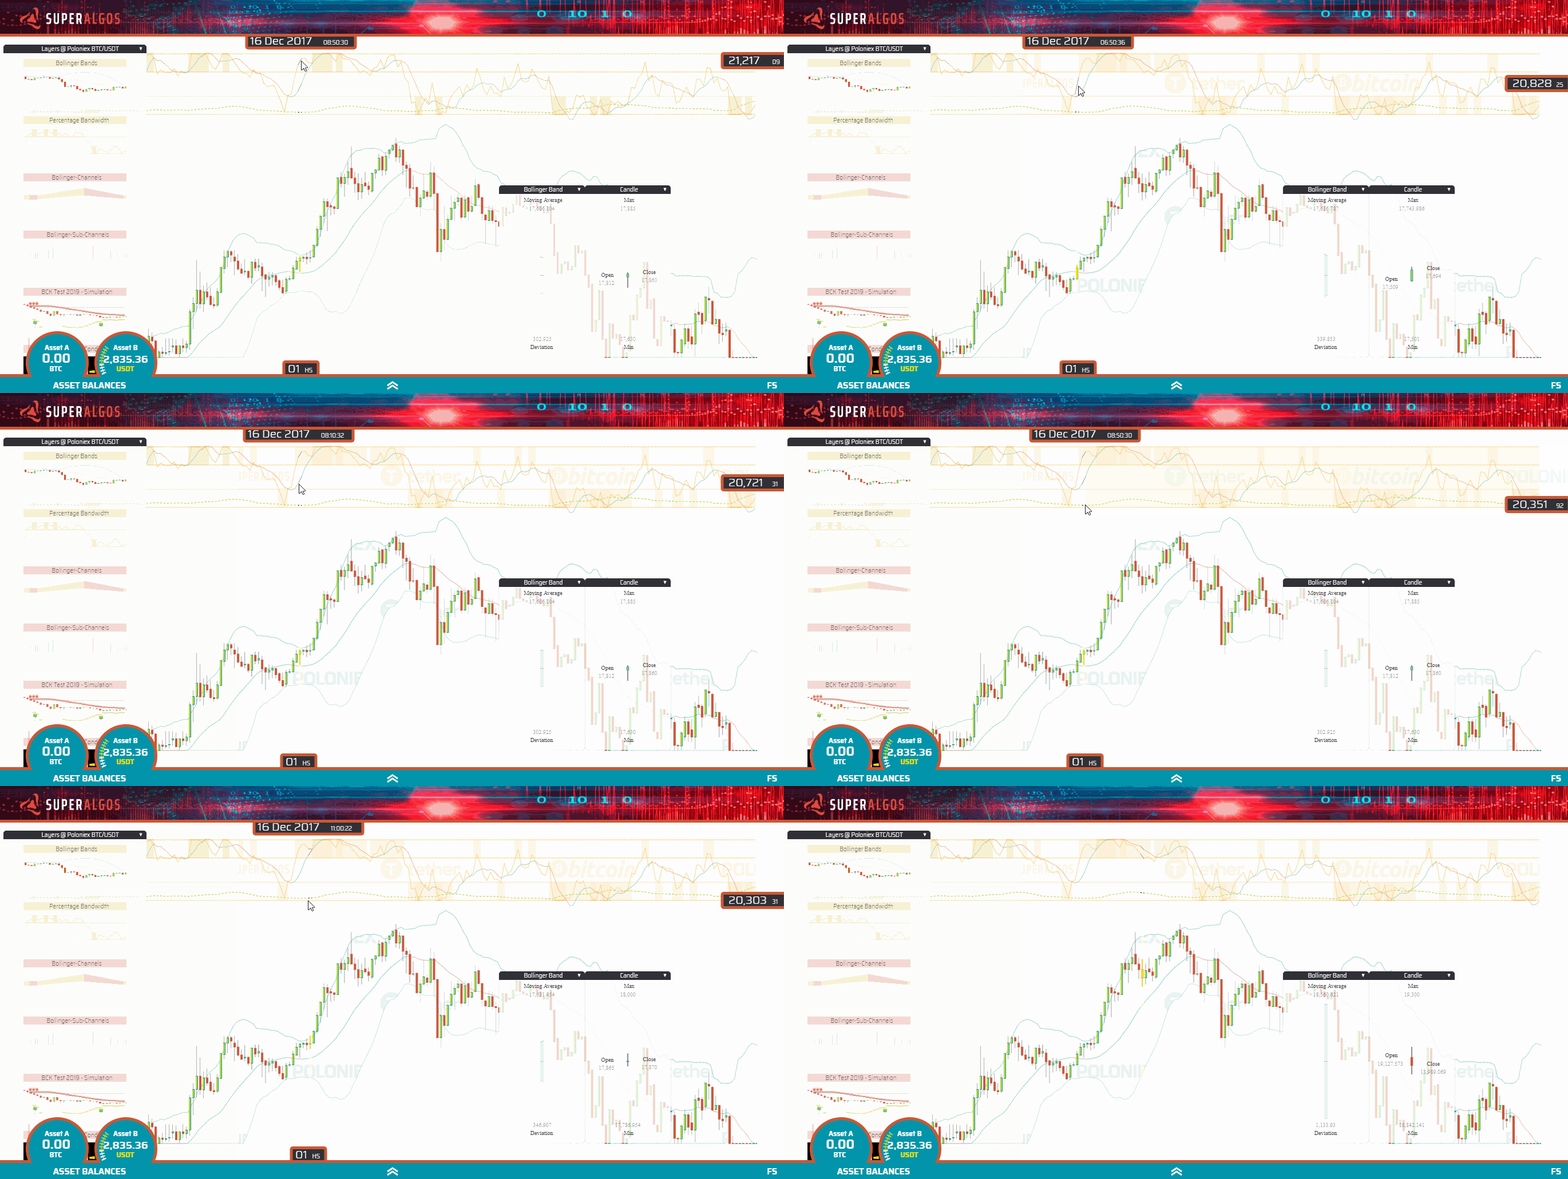
This is a non-standard indicator derived from the Bollinger Bands. These types of channels are calculated using the Bollinger Bands moving average. Essentially an upward channel begins when the moving average changes direction from going down to going up, and the channel finishes when it turns from going up to down. A downward channel starts when the Bollinger Band moving average turns from going up to down, and it finishes when it starts going up again. Upward channels are plotted in green, while downward channels in red. Additional information can be found at the indicator's panel, like the number of periods contained at the channel.
Bollinger Sub-Channels
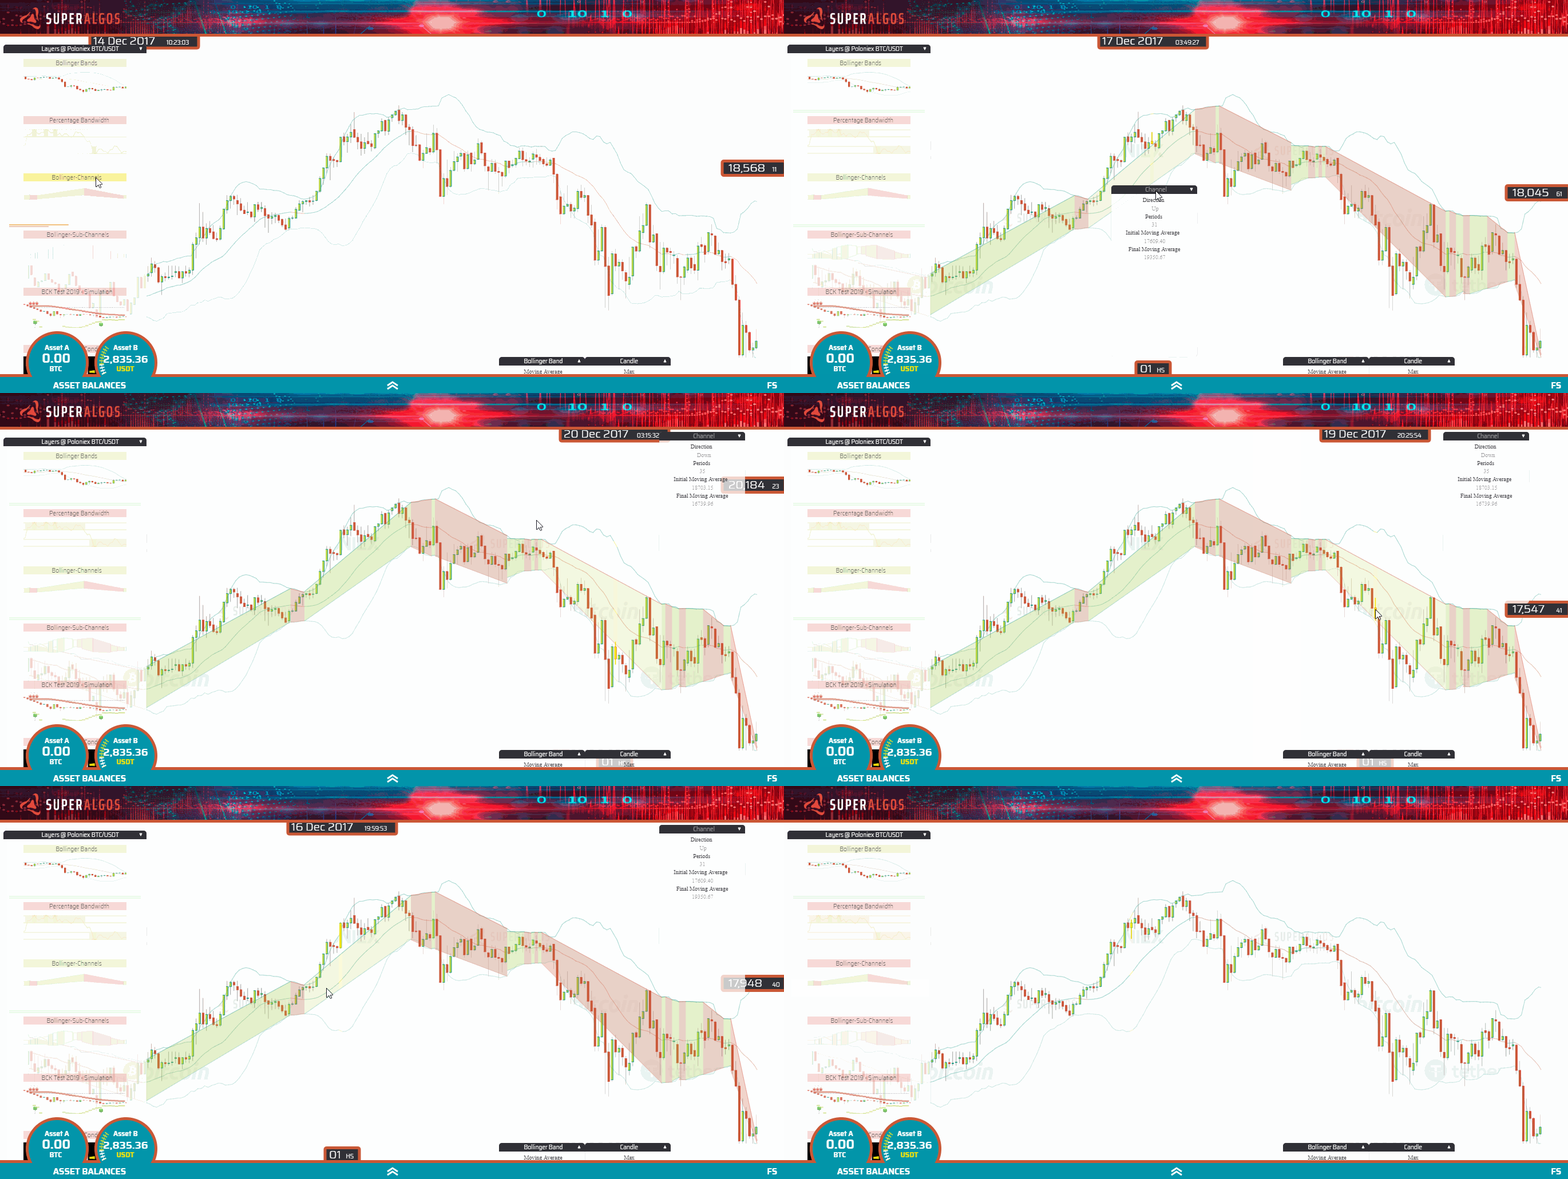
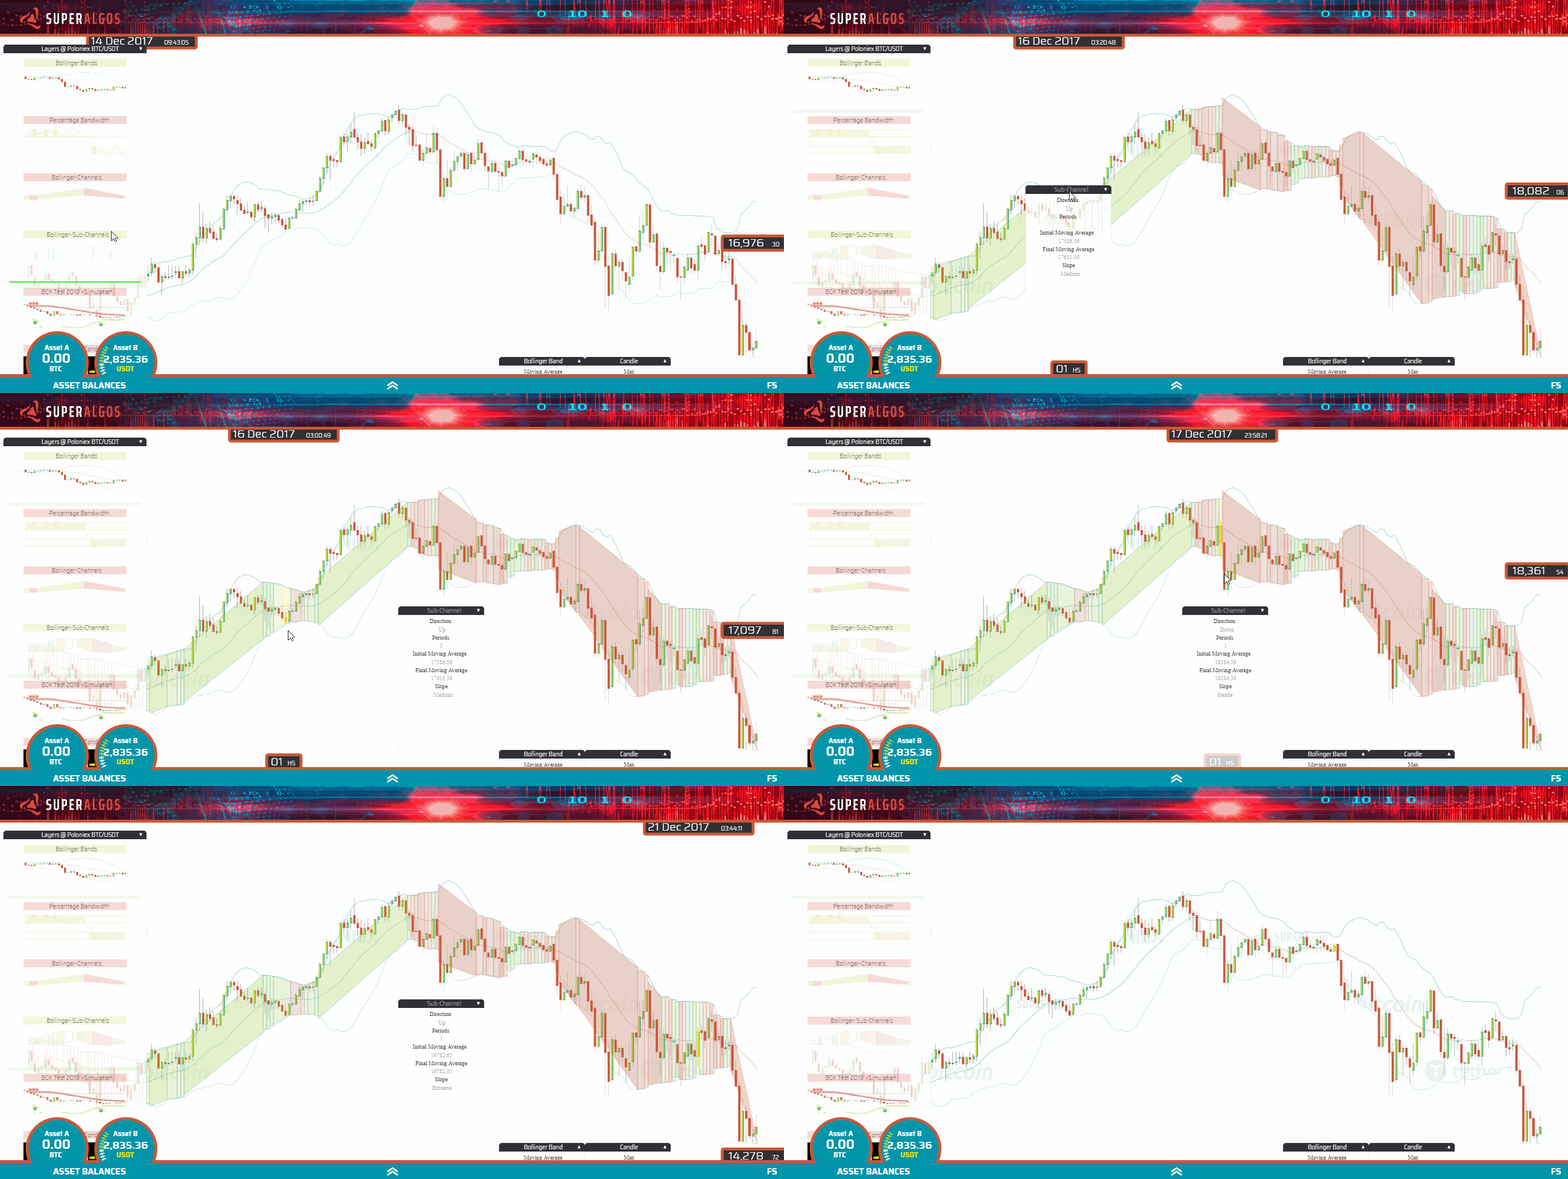
If we consider that one Bollinger Channel can have sub-channels in the same direction (up or down) but different slopes, then we get to the concept of Bollinger Sub-Channels. The most important property of a sub-channel is its slope. The possible values are Side, Gentle, Medium, High and Extreme. With this information, a trading bot could easily ask if it is in a sub-channel with a certain slope and for how many periods. The slope or inclination of the moving average may be an indication of momentum.
Indicators Not Included in the Data Release
The following list of indicators are not included in the data release, therefore, they will show nothing when you switch the corresponding layer on, until you get the appropriate bots to calculate the data.
To learn how to get ready to use these indicators, please refer to the Using indicators not included in the data release page.
Most of the indicators listed here come with several products, each with different settings for the said indicator. To learn all the details, check the Indicators not included in the data release page under the Writing Conditions & Formulas section of this User Manual.
Relative Strength Index (RSI 14)
According to Investopedia, "The relative strength index (RSI) is a momentum indicator that measures the magnitude of recent price changes to evaluate overbought or oversold conditions in the price of a stock or other asset. The RSI is displayed as an oscillator (a line graph that moves between two extremes) and can have a reading from 0 to 100."
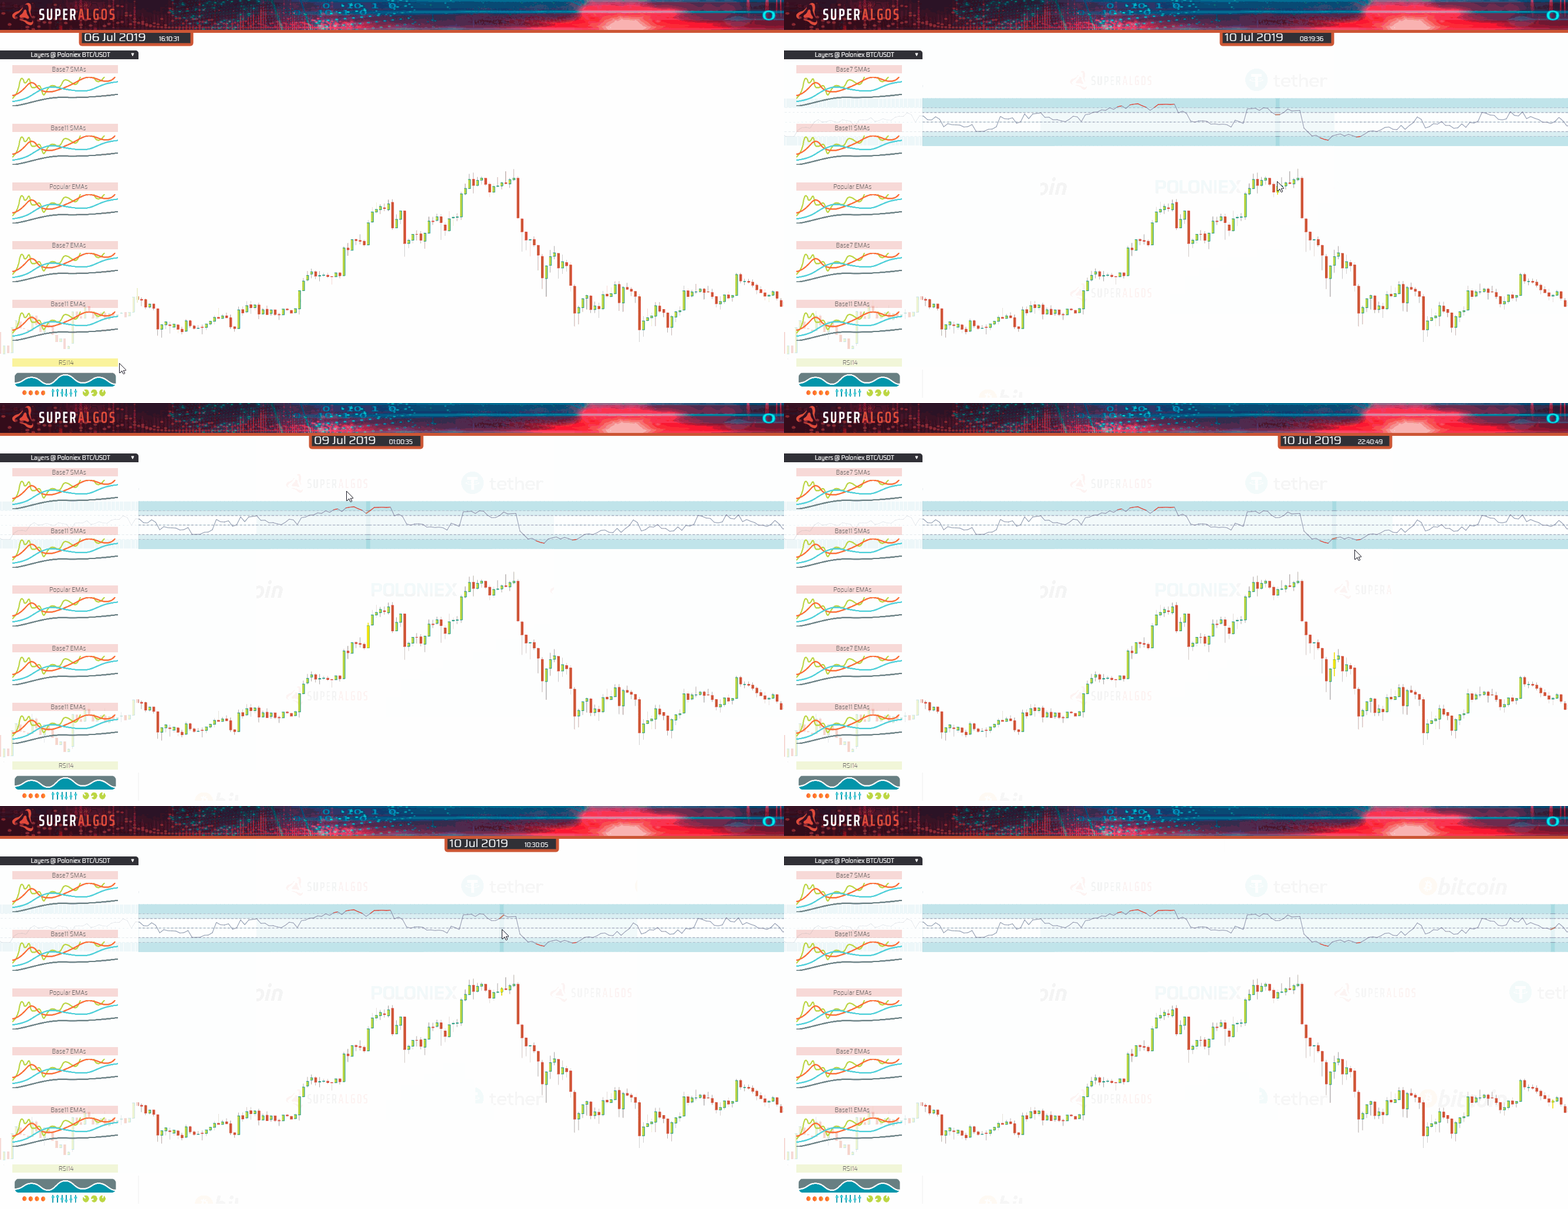
The chart for this indicator shows the RSI oscillating in a scale ranging from 0 at the bottom to 100 at the top. The bottom section of the chart shows a blue background covering the range from 0 to 20, also marked by a dotted line. When the RSI value falls below the 20 mark, the RSI line turns red, for easier viasualization. Also in the bottom section, there is a second dotted line signaling the 30 mark.
The equivalent (although reversed) effect is featured on the top half of the charts, with dotted lines signaling the 70 and 80 levels, and a blue background above 80.
There is also a dotted line at the 50 mark, signaling the median of the chart.
For the time being, the chart is fixed on the screen and the user may not move it.
Simple Moving Average (SMA)
According to Investopedia, "A simple moving average (SMA) is an arithmetic moving average calculated by adding recent closing prices and then dividing that by the number of time periods in the calculation average. Short-term averages respond quickly to changes in the price of the underlying asset, while long-term averages are slow to react."
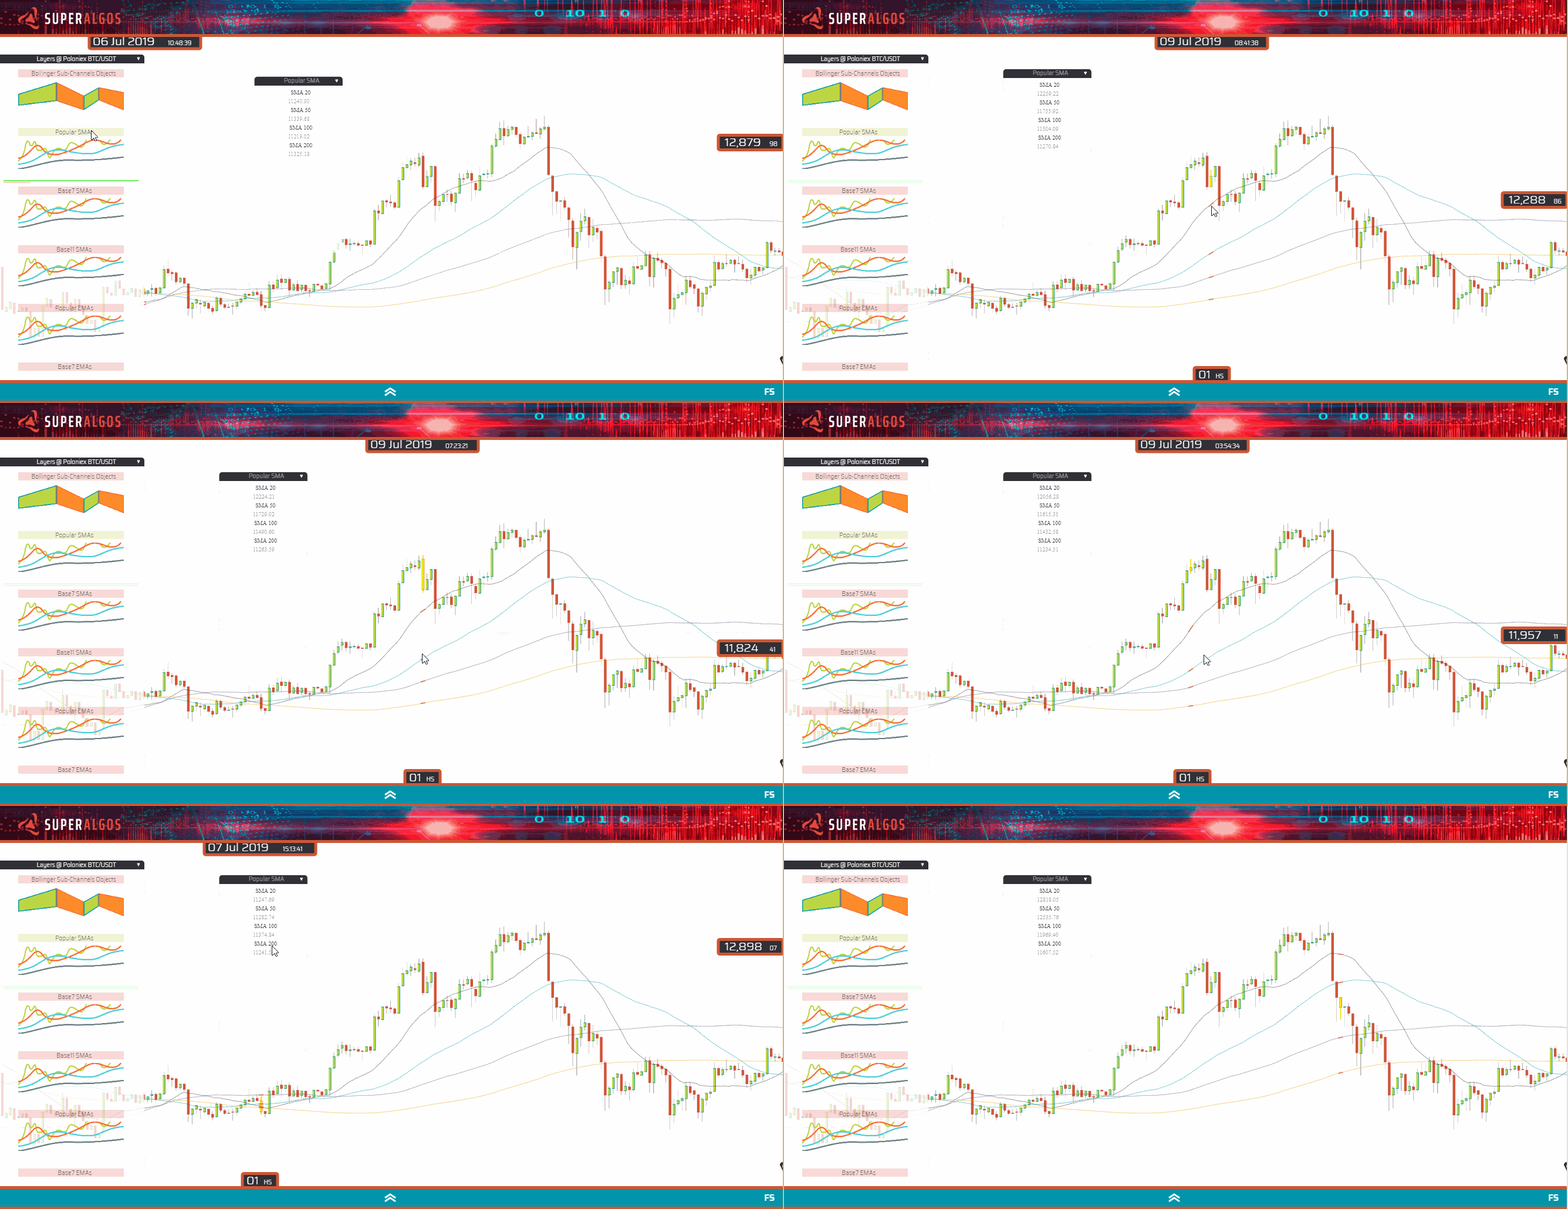
You will find several layers with different settings for SMAs, calculated on different periods. Each layer corresponds to a product made available by the indicator.
The information panel shows the numeric value for each SMA in the layer, in ascending order (i.e. SMA 20, SMA 50, SMA 100, etc.).
Exponential Moving Average (EMA)
According to Investopedia, "An exponential moving average (EMA) is a type of moving average (MA) that places a greater weight and significance on the most recent data points. The exponential moving average is also referred to as the exponentially weighted moving average. An exponentially weighted moving average reacts more significantly to recent price changes than a simple moving average (SMA), which applies an equal weight to all observations in the period."
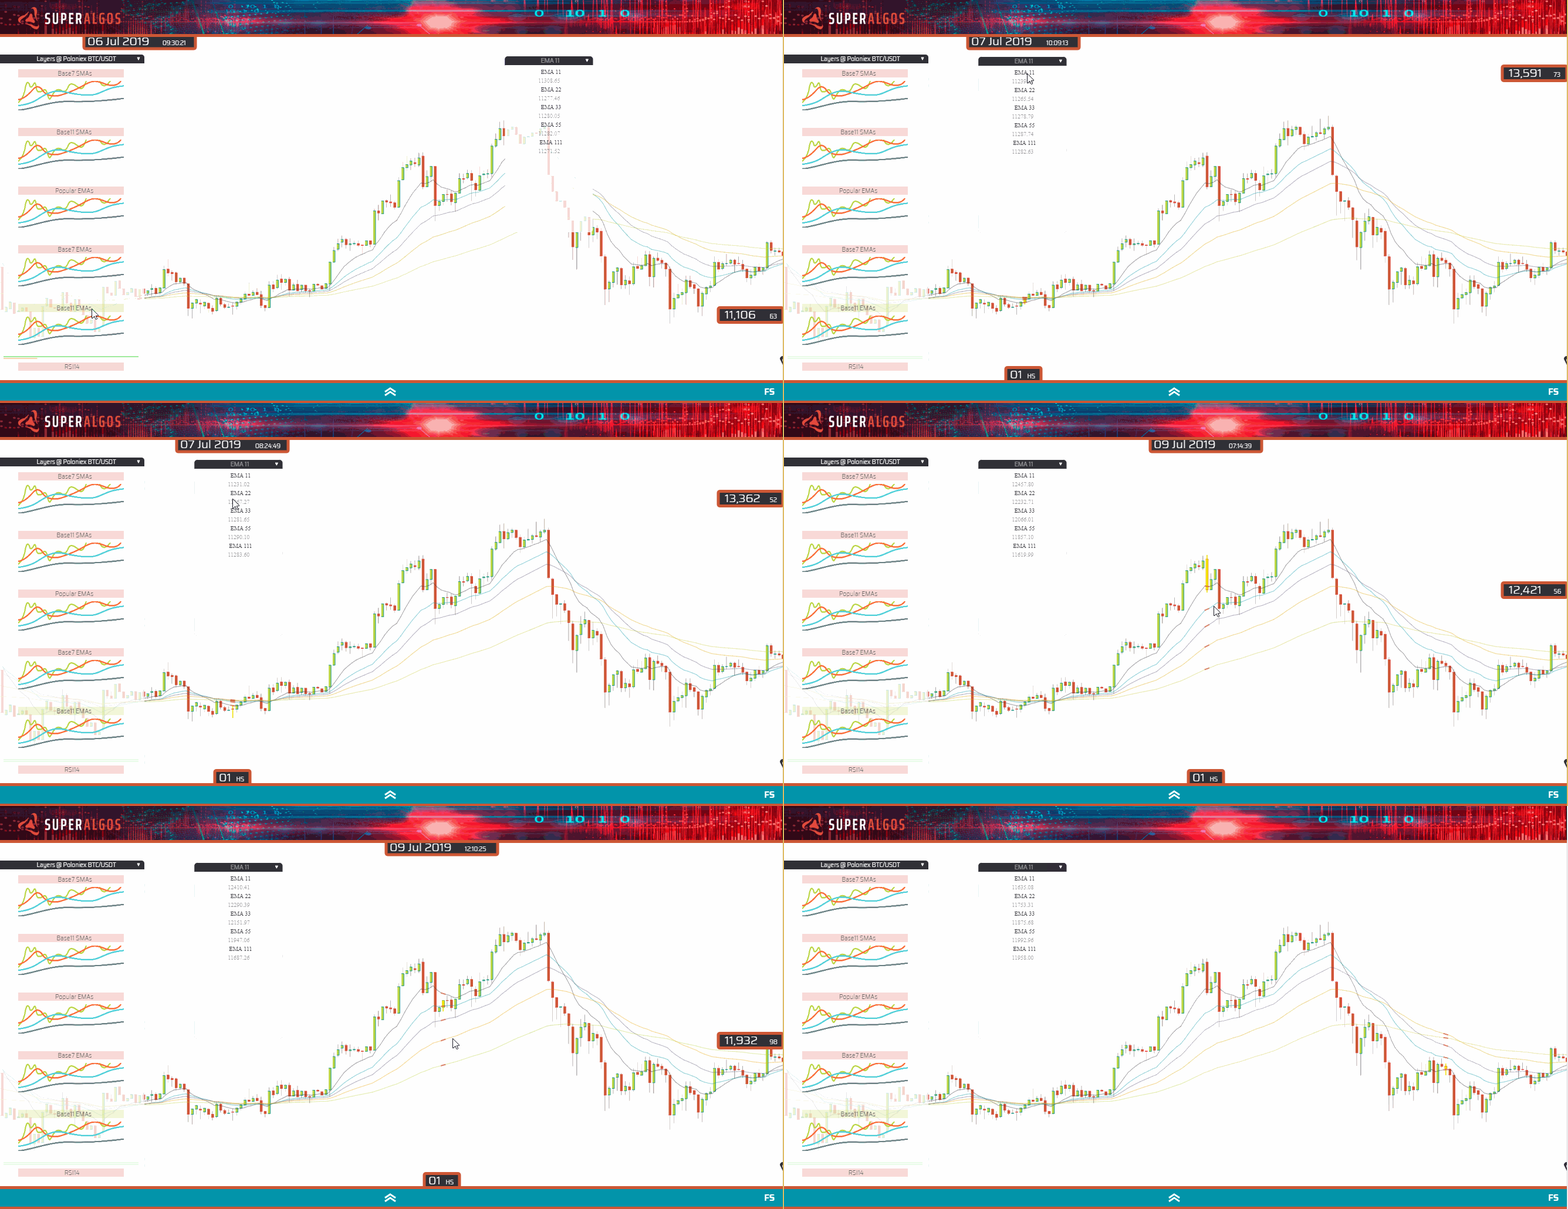
The same explanations offered for SMAs apply to EMAs.
Simulation Layers
Simulation layers are those resulting from the graphic representation of strategies' actions, and are explained further down this User Manual, when discussing Simulation layers and the Live trading history layer.